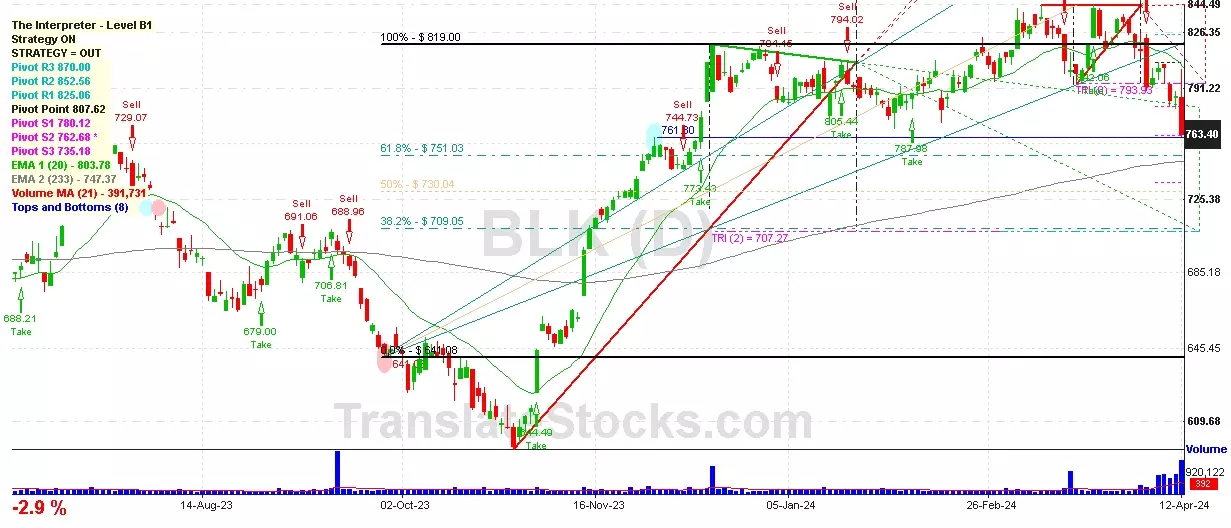
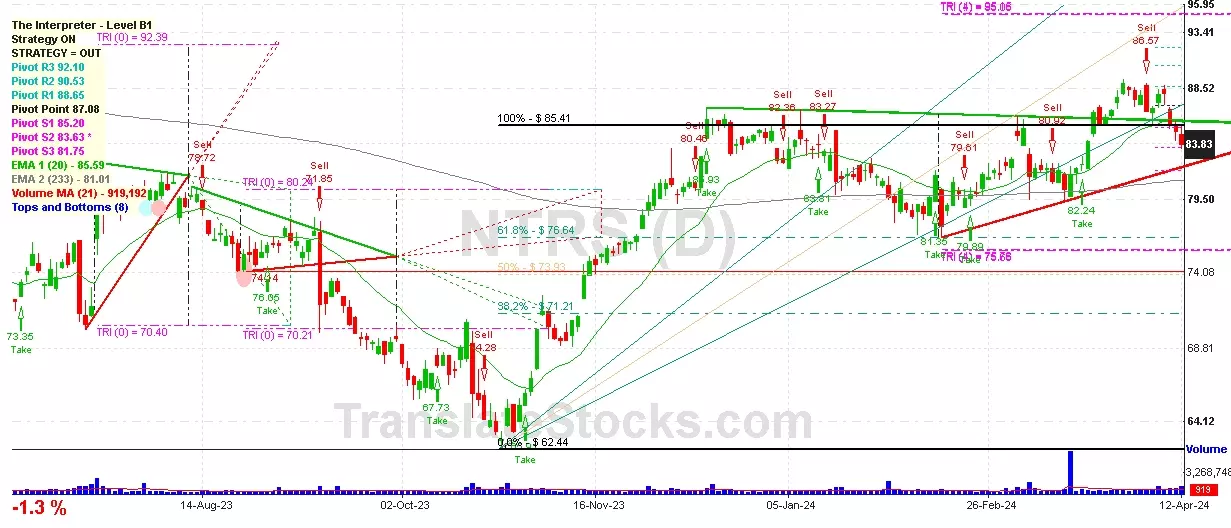
Hey Friend, I'm analysing NORTHERN TRUST CORP (NTRS), and it is between the Support of $ 83.63 (PivotS2) and the Resistance of $ 85.20 (PivotS1). The stock is also approaching the line of PivotS2 at $ 83.63, and if it goes below this line it could reach the next Support of Triangle projection at $80.24.

| Date | Price $ | Result % | Candle Name | Side |
|---|---|---|---|---|
| 001 10 Apr 2024 | Sell Price: 85.41 | Profit: Close Day1 ($ 84.93) | Abandoned Baby | Sell |
| 002 03 Apr 2024 | Buy Price: 87.93 | Profit: Open Day1 ($ 88.80) | Piercing Line | Buy |
| 003 15 Mar 2024 | Buy Price: 81.46 | Profit: Open Day1 ($ 81.58) | Engulfing | Buy |
| 004 28 Feb 2024 | Sell Price: 81.44 | Loss: Close Day2 ($ 82.66) | Abandoned Baby | Sell |
| 005 26 Jan 2024 | Sell Price: 81.60 | Profit: Open Day1 ($ 81.23) | Engulfing | Sell |
| 006 23 Jan 2024 | Sell Price: 81.25 | Profit: Close Day1 ($ 80.88) | Engulfing | Sell |
| 007 02 Jan 2024 | Buy Price: 84.87 | Loss: Close Day2 ($ 82.36) | Engulfing | Buy |
| 008 27 Oct 2023 | Sell Price: 63.54 | Loss: Close Day2 ($ 65.91) | Engulfing | Sell |
| 009 08 Sep 2023 | Buy Price: 76.39 | Profit: Open Day1 ($ 76.81) | Abandoned Baby | Buy |
| 010 17 Aug 2023 | Buy Price: 76.95 | Loss: Close Day2 ($ 76.19) | Abandoned Baby | Buy |
| 011 08 Aug 2023 | Sell Price: 79.59 | Profit: Close Day1 ($ 79.00) | Abandoned Baby | Sell |
| 012 12 Jul 2023 | Sell Price: 74.65 | Profit: Close Day2 ($ 71.19) | Engulfing | Sell |
| 013 12 Jul 2023 | Sell Price: 74.63 | Profit: Close Day2 ($ 71.19) | Dark Cloud Cover | Sell |
| 014 26 Jun 2023 | Buy Price: 71.74 | Profit: Close Day1 ($ 72.35) | Abandoned Baby | Buy |
| 015 26 Jun 2023 | Buy Price: 71.78 | Profit: Close Day1 ($ 72.35) | Engulfing | Buy |
| 016 12 Jun 2023 | Sell Price: 73.59 | Loss: Close Day2 ($ 74.25) | Engulfing | Sell |
| 017 06 Jun 2023 | Buy Price: 75.56 | Profit: Open Day1 ($ 75.68) | Engulfing | Buy |
| 018 01 Jun 2023 | Buy Price: 73.04 | Profit: Open Day1 ($ 74.47) | Engulfing | Buy |
| 019 31 May 2023 | Sell Price: 71.92 | Profit: Open Day1 ($ 71.89) | Abandoned Baby | Sell |
| 020 25 May 2023 | Buy Price: 71.78 | Profit: Close Day1 ($ 72.62) | Piercing Line | Buy |
| 021One Year Average | Both Sides Result for 20 Signals |
Profit: $ 6.20 ($ 0.31 / Signal) |
All of Them | Buy + Sell |
| Simple Moving Averages (SMA) Period | Value $ | Signal | Exponential Moving Averages (EMA) Period | Value $ | Signal | |
|---|---|---|---|---|---|---|
| 2 | 81.32 | BUY | 2 | 81.33 | BUY | |
| 3 | 80.73 | BUY | 3 | 81.49 | SELL | |
| 5 | 81.95 | SELL | 5 | 82.12 | SELL | |
| 8 | 83.53 | SELL | 8 | 83.02 | SELL | |
| 13 | 85.00 | SELL | 13 | 83.87 | SELL | |
| 21 | 85.66 | SELL | 21 | 84.22 | SELL | |
| 34 | 84.31 | SELL | 34 | 83.99 | SELL | |
| 55 | 82.66 | SELL | 55 | 83.24 | SELL | |
| 90 | 82.81 | SELL | 90 | 81.96 | SELL | |
| 200 | 77.69 | BUY | 200 | 80.67 | BUY |
Northern Trust Corp
IPO: 2009-04-29
Ticker: NTRSIndices: S&P 500,
Exchange: Nasdaq Nms - Global Market (US - USD)
Website: https://www.northerntrust.com/
Phone:
Common Stock
Finance (
State Commercial Banks
Year | 2020 | 2019 | 2018 | 2017 | 2016 | 2015 | 2014 | 2013 | 2012 | 2011 | 2010 | 2009 | 2008 | 2007 | |
|---|---|---|---|---|---|---|---|---|---|---|---|---|---|---|---|
| 1 | Assets + | 170,004 | 136,828 | 132,212 | 138,590 | 123,927 | 116,750 | 109,946 | 102,947 | 97,464 | 100,224 | 83,844 | 82,142 | 82,054 | 0 |
| 2 | Property + | 515 | 483 | 428 | 465 | 467 | 447 | 444 | 459 | 470 | 494 | 504 | 544 | 507 | 0 |
| 3 | Property + | 1,613 | 1,467 | 1,317 | 1,336 | 1,236 | 1,138 | 1,061 | 1,177 | 1,130 | 1,058 | 879 | 947 | 0 | 0 |
| 4 | Intangible Assets + | 0 | 121 | 139 | 161 | 42 | 46 | 60 | 83 | 104 | 123 | 53 | 61 | 0 | 0 |
| 5 | Finite-Lived Intangible Assets + | 0 | 121 | 139 | 161 | 42 | 46 | 60 | 83 | 104 | 123 | 53 | -96 | 0 | 0 |
| 6 | Liabilities and Equity + | 170,004 | 136,828 | 132,212 | 138,590 | 123,927 | 116,750 | 109,946 | 102,947 | 97,464 | 100,224 | 83,844 | 82,142 | 82,054 | 4,509 |
| 7 | Liabilities + | 158,316 | 125,737 | 121,704 | 128,374 | 114,156 | 108,044 | 101,498 | 95,035 | 89,937 | 93,106 | 77,014 | 75,829 | 75,664 | 0 |
| 8 | Stockholders' Equity + | 11,688 | 11,091 | 10,508 | 10,216 | 9,770 | 8,706 | 8,449 | 7,912 | 7,527 | 7,117 | 6,830 | 6,312 | 6,389 | 4,509 |
| 9 | Stockholders' Equity Attributable to Parent + | 11,688 | 11,091 | 10,508 | 10,216 | 9,770 | 8,706 | 8,449 | 7,912 | 7,527 | 7,117 | 6,830 | 6,312 | 6,389 | 4,509 |
| 10 | Stockholders' Equity + | 1.67 | 1.67 | 1.67 | 1.67 | 1.67 | 1.67 | 1.67 | 1.67 | 1.67 | 1.67 | 1.67 | 1.67 | 1.67 | 0 |
| 11 | Common Stock + | 1.67 | 1.67 | 1.67 | 1.67 | 1.67 | 1.67 | 1.67 | 1.67 | 1.67 | 1.67 | 1.67 | 1.67 | 1.67 | 0 |
| 12 | Partners' Capital + | 12,208 | 11,657 | 10,777 | 9,685 | 8,908 | 8,243 | 7,625 | 7,135 | 6,703 | 6,302 | 5,972 | 5,576 | 5,091 | -90 |
| 13 | Partners' Capital + | 12,208 | 11,657 | 10,777 | 9,685 | 8,908 | 8,243 | 7,625 | 7,135 | 6,703 | 6,302 | 5,972 | 5,576 | 5,091 | -90 |
| 14 | Limited Liability Company (LLC) Members' Equity + | 12,636 | 11,462 | 10,323 | 9,271 | 8,538 | 7,870 | 7,305 | 6,891 | 6,420 | 5,956 | 5,667 | 5,214 | 4,596 | -90 |
| 15 | Limited Liability Company (LLC) Members' Equity + | 12,636 | 11,462 | 10,323 | 9,271 | 8,538 | 7,870 | 7,305 | 6,891 | 6,420 | 5,956 | 5,667 | 5,214 | 4,596 | -90 |
| 16 | Long-Term Other Undisclosed Assets | 167,651 | 0 | 0 | 0 | 0 | 0 | 0 | 0 | 0 | 0 | 0 | 0 | 81,158 | 0 |
| 17 | Long-Term Assets + | 169,489 | 1,232 | 726 | 737 | 703 | 915 | 1,081 | 1,212 | 1,212 | 1,246 | 1,183 | 1,172 | 81,547 | 0 |
| 18 | Increase (Decrease) in Stockholders' Equity [Roll Forward] + | -3,204 | -3,066 | -2,174 | -1,392 | -1,094 | -1,034 | -705 | -423 | -314 | -226 | -165 | -199 | -266 | 0 |
| 19 | Treasury Stock Transactions + | -3,204 | -3,066 | -2,174 | -1,392 | -1,094 | -1,034 | -705 | -423 | -314 | -226 | -165 | -199 | -266 | 0 |
| 20 | Treasury Stock + | -3,204 | -3,066 | -2,174 | -1,392 | -1,094 | -1,034 | -705 | -423 | -314 | -226 | -165 | -199 | -266 | 0 |
| 21 | Operating Lease + | 560 | 492 | 0 | 0 | 0 | 0 | 0 | 0 | 0 | 0 | 0 | 0 | 0 | 0 |
| 22 | Leveraged Leases + | 571 | 535 | 57 | 131 | 184 | 389 | 548 | 671 | 674 | 714 | 782 | 770 | 0 | 0 |
| 23 | Goodwill + | 707 | 697 | 669 | 606 | 519 | 526 | 533 | 541 | 538 | 532 | 401 | 402 | 389 | 0 |
| 24 | Total Assets + | 170,004 | 136,828 | 132,212 | 138,590 | 123,927 | 116,750 | 109,946 | 102,947 | 97,464 | 100,224 | 83,844 | 82,142 | 82,054 | 0 |
| 25 | Total Liabilities + | 158,316 | 125,737 | 121,704 | 128,374 | 114,156 | 108,044 | 101,498 | 95,035 | 89,937 | 93,106 | 77,014 | 75,829 | 75,664 | 0 |
| 26 | Total Liabilities and Equity + | 170,004 | 136,828 | 132,212 | 138,590 | 123,927 | 116,750 | 109,946 | 102,947 | 97,464 | 100,224 | 83,844 | 82,142 | 82,054 | 0 |
Year | 2020 | 2019 | 2018 | 2017 | 2016 | 2015 | 2014 | 2013 | 2012 | 2011 | 2010 | 2009 | 2008 | 2007 | |
|---|---|---|---|---|---|---|---|---|---|---|---|---|---|---|---|
| 1 | 6,101 | 6,073 | 5,960 | 5,375 | 4,962 | 4,703 | 4,331 | 4,089 | 3,896 | 3,770 | 3,648 | 3,787 | 4,278 | 0 | |
| 2 | 0 | 0 | 0 | 0 | 0 | -43 | 6 | 20 | 25 | 55 | 160 | 215 | 115 | 18 | |
| 3 | 116 | 103 | 109 | 101 | 89 | 90 | 91 | 92 | 88 | 89 | 94 | 96 | 0 | 0 | |
| 4 | 0 | 0 | 0 | 0 | 0 | 0 | 0 | 33 | -1 | 1 | 0 | 0 | 0 | 0 | |
| 5 | 194 | 146 | 128 | 158 | 241 | 0 | 0 | 0 | 0 | 0 | 0 | 0 | 0 | 0 | |
| 6 | 0 | 0 | 0 | 0 | 0 | 0 | 0 | 0 | 0 | -24 | -20 | -23 | -56 | 6 | |
| 7 | 290 | 251 | 307 | 210 | 237 | 262 | 210 | 244 | 206 | 324 | 382 | 446 | 616 | 351 | |
| 8 | 200 | 822 | 699 | 340 | 182 | 154 | 181 | 222 | 297 | 400 | 378 | 406 | 1,399 | 1,939 | |
| 9 | 0 | 0 | 0 | 0 | 0 | 0 | 0 | 0 | 0 | 0 | 990 | 1,255 | 1,276 | 1,061 | |
| 10 | 1,628 | 1,944 | 1,958 | 1,634 | 1,517 | 1,465 | 1,190 | 1,076 | 992 | 884 | 990 | 1,255 | 0 | 0 | |
| 11 | -418 | -452 | -401 | -435 | -485 | -491 | -378 | -344 | -305 | -280 | -320 | -391 | -481 | -334 | |
| 12 | Total Net Income (Loss) Attributable to Parent + | 1,209 | 1,492 | 1,556 | 1,199 | 1,032 | 974 | 812 | 731 | 687 | 604 | 670 | 864 | 795 | 727 |
| 13 | Preferred Stock Dividends + | 56 | 46 | 46 | 50 | 23 | 23 | 10 | 0 | 0 | 0 | 0 | 0 | 0 | 0 |
| 14 | -12 | -17 | -20 | -19 | -19 | -15 | -13 | -12 | -10 | 0 | 0 | 0 | 0 | 0 | |
| 15 | 1,153 | 1,446 | 1,510 | 1,149 | 1,009 | 950 | 802 | 731 | 687 | 604 | 670 | 753 | 783 | 727 | |
| 16 | Total Earnings Per Share + | 5.48 | 6.66 | 6.68 | 4.95 | 4.35 | 4.03 | 3.34 | 3.01 | 2.82 | 2.47 | 2.74 | 3.18 | 3.51 | 3.28 |
| 17 | Total Earnings Per Share + | 5.46 | 6.63 | 6.64 | 4.92 | 4.32 | 3.99 | 3.32 | 2.99 | 2.81 | 2.47 | 2.74 | 3.16 | 3.47 | 3.23 |
| 18 | 2.80 | 2.60 | 1.94 | 1.60 | 0 | 0 | 0 | 0 | 0 | 0 | 1.12 | 1.12 | 1.12 | 1.03 |
 Click to Enlarge