Hey Friend, I'm analysing NVIDIA CORP (NVDA), and it is between the Support of $ 264.99 (Pivot) and the Resistance of $ 278.69 (PivotR1). The stock is also approaching the line of Pivot at $ 264.99, and if it goes below this line it could reach the next Support of 200% of Fibonacci at $ 238.63.
Date | Price $ | Result % | Candle Name | Side |
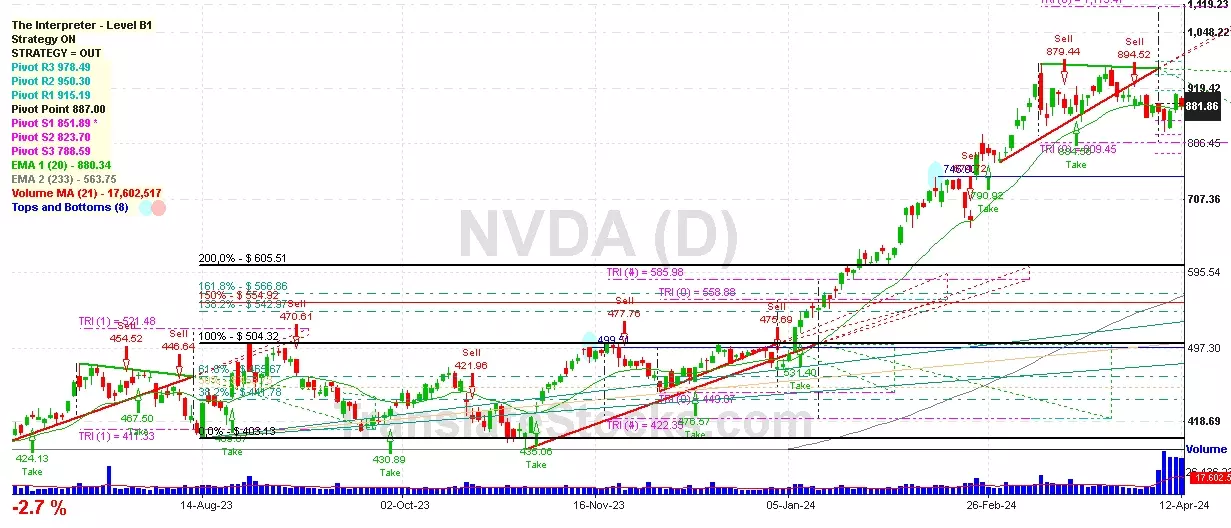
---|---|---|---|---|
001 29 Dec 2022 | Buy Price: 146.03 | Profit: Close Day1 ($ 146.14) | Abandoned Baby | Buy |
002 21 Dec 2022 | Buy Price: 165.01 | Loss: Close Day2 ($ 152.06) | Abandoned Baby | Buy |
003 02 Dec 2022 | Sell Price: 168.76 | Profit: Open Day1 ($ 166.79) | Abandoned Baby | Sell |
004 22 Nov 2022 | Buy Price: 160.38 | Profit: Open Day1 ($ 160.98) | Abandoned Baby | Buy |
005 16 Nov 2022 | Sell Price: 159.10 | Profit: Open Day1 ($ 157.15) | Abandoned Baby | Sell |
006 09 Nov 2022 | Sell Price: 137.76 | Loss: Close Day2 ($ 163.27) | Abandoned Baby | Sell |
007 03 Oct 2022 | Buy Price: 125.12 | Profit: Open Day1 ($ 128.79) | Abandoned Baby | Buy |
008 16 Sep 2022 | Buy Price: 131.98 | Profit: Close Day1 ($ 133.82) | Engulfing | Buy |
009 18 Aug 2022 | Buy Price: 187.73 | Loss: Close Day2 ($ 170.34) | Engulfing | Buy |
010 10 Aug 2022 | Buy Price: 180.97 | Profit: Open Day1 ($ 181.31) | Abandoned Baby | Buy |
011 27 Jul 2022 | Buy Price: 177.90 | Profit: Open Day1 ($ 179.75) | Abandoned Baby | Buy |
012 13 Jul 2022 | Buy Price: 151.64 | Profit: Close Day1 ($ 153.72) | Piercing Line | Buy |
013 05 Jul 2022 | Buy Price: 149.64 | Profit: Open Day1 ($ 150.10) | Engulfing | Buy |
014 22 Jun 2022 | Sell Price: 163.60 | Profit: Close Day1 ($ 162.25) | Abandoned Baby | Sell |
015 02 Jun 2022 | Buy Price: 195.92 | Loss: Close Day2 ($ 187.86) | Engulfing | Buy |
016 25 May 2022 | Buy Price: 169.75 | Profit: Close Day1 ($ 178.51) | Engulfing | Buy |
017 13 May 2022 | Buy Price: 177.06 | Profit: Open Day2 ($ 180.74) | Abandoned Baby | Buy |
018 05 May 2022 | Sell Price: 188.44 | Profit: Open Day1 ($ 187.36) | Abandoned Baby | Sell |
019 28 Apr 2022 | Buy Price: 197.82 | Loss: Close Day2 ($ 195.33) | Abandoned Baby | Buy |
020 25 Apr 2022 | Buy Price: 199.02 | Loss: Close Day2 ($ 184.15) | Piercing Line | Buy |
021 20 Apr 2022 | Sell Price: 214.82 | Profit: Close Day1 ($ 201.83) | Engulfing | Sell |
022One Year Average | Both Sides Result for 21 Signals |
Loss: $ -38.54 ($ -1.84 / Signal) |
All of Them | Buy + Sell |
Simple Moving Averages (SMA) Period | Value $ | Signal | Exponential Moving Averages (EMA) Period | Value $ | Signal | |
---|---|---|---|---|---|---|
2 | 266.55 | SELL | 2 | 266.28 | SELL | |
3 | 268.34 | SELL | 3 | 266.31 | SELL | |
5 | 266.34 | SELL | 5 | 264.77 | BUY | |
8 | 262.92 | BUY | 8 | 261.19 | BUY | |
13 | 252.30 | BUY | 13 | 255.39 | BUY | |
21 | 245.54 | BUY | 21 | 247.44 | BUY | |
34 | 236.14 | BUY | 34 | 236.20 | BUY | |
55 | 216.34 | BUY | 55 | 221.36 | BUY | |
90 | 194.43 | BUY | 90 | 205.06 | BUY | |
200 | 170.32 | BUY | 200 | 190.30 | BUY |
Nvidia Corp
IPO: 1999-01-22
Ticker: NVDAIndices: S&P 500,
Nasdaq 100,
Exchange: Nasdaq Nms - Global Market (US - USD)
Website: https://www.nvidia.com/
Phone:
Common Stock
Manufacturing (
Semiconductors & Related Devices