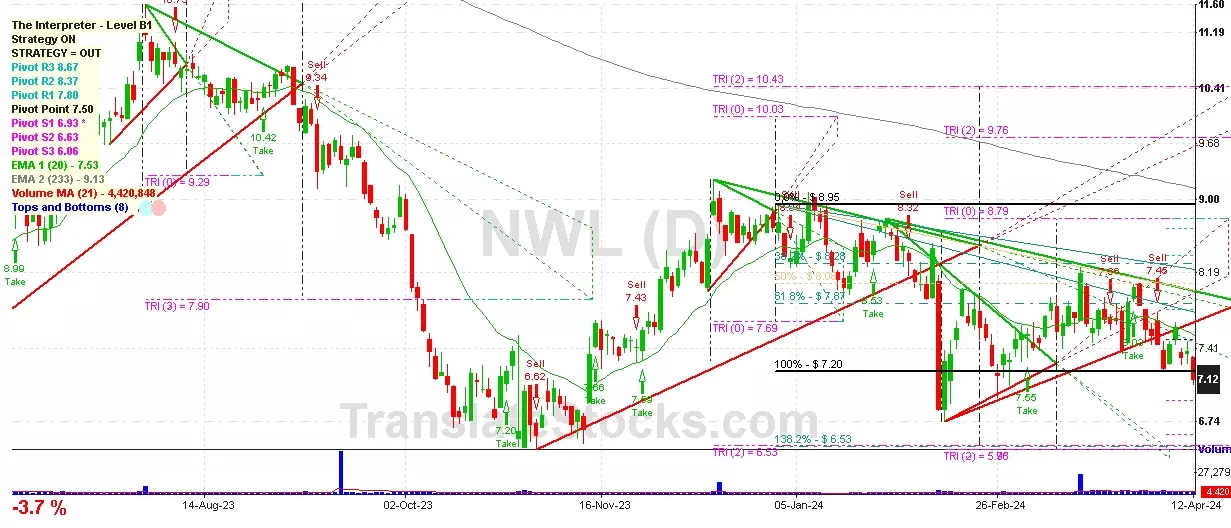
Hey Friend, I'm analysing NEWELL BRANDS INC (NWL), and it is between the Support of $ 6.93 (PivotS1) and the Resistance of $ 7.20 (100% of Fibonacci). The stock is also approaching the line of PivotS1 at $ 6.93, and if it goes below this line it could reach the next Support of 138.2% of Fibonacci at $ 6.53.

| Date | Price $ | Result % | Candle Name | Side |
|---|---|---|---|---|
| 001 15 Mar 2024 | Buy Price: 8.18 | Loss: Close Day2 ($ 7.61) | Engulfing | Buy |
| 002 20 Feb 2024 | Buy Price: 7.80 | Loss: Close Day2 ($ 7.52) | Engulfing | Buy |
| 003 16 Feb 2024 | Sell Price: 7.67 | Profit: Open Day1 ($ 7.65) | Abandoned Baby | Sell |
| 004 23 Jan 2024 | Sell Price: 8.36 | Profit: Close Day1 ($ 8.30) | Dark Cloud Cover | Sell |
| 005 05 Jan 2024 | Buy Price: 8.41 | Profit: Close Day1 ($ 8.55) | Engulfing | Buy |
| 006 20 Sep 2023 | Sell Price: 9.51 | Profit: Open Day1 ($ 9.45) | Engulfing | Sell |
| 007 11 Aug 2023 | Sell Price: 10.57 | Profit: Open Day1 ($ 10.50) | Abandoned Baby | Sell |
| 008 25 Jul 2023 | Sell Price: 10.02 | Loss: Close Day2 ($ 10.25) | Abandoned Baby | Sell |
| 009 25 Jul 2023 | Sell Price: 10.04 | Profit: Open Day1 ($ 10.02) | Engulfing | Sell |
| 010 18 Jul 2023 | Buy Price: 9.72 | Profit: Open Day1 ($ 9.80) | Abandoned Baby | Buy |
| 011 18 Jul 2023 | Buy Price: 9.75 | Profit: Open Day1 ($ 9.80) | Engulfing | Buy |
| 012 24 May 2023 | Sell Price: 8.71 | Profit: Open Day1 ($ 8.60) | Engulfing | Sell |
| 013One Year Average | Both Sides Result for 12 Signals |
Loss: $ -0.46 ($ -0.04 / Signal) |
All of Them | Buy + Sell |
| Simple Moving Averages (SMA) Period | Value $ | Signal | Exponential Moving Averages (EMA) Period | Value $ | Signal | |
|---|---|---|---|---|---|---|
| 2 | 7.09 | SELL | 2 | 7.05 | SELL | |
| 3 | 7.04 | BUY | 3 | 7.03 | BUY | |
| 5 | 6.98 | BUY | 5 | 7.03 | BUY | |
| 8 | 6.99 | BUY | 8 | 7.05 | SELL | |
| 13 | 7.14 | SELL | 13 | 7.13 | SELL | |
| 21 | 7.32 | SELL | 21 | 7.24 | SELL | |
| 34 | 7.48 | SELL | 34 | 7.38 | SELL | |
| 55 | 7.51 | SELL | 55 | 7.53 | SELL | |
| 90 | 7.91 | SELL | 90 | 7.73 | SELL | |
| 200 | 8.40 | SELL | 200 | 8.63 | SELL |
Newell Brands Inc
IPO: 1979-06-28
Ticker: NWLIndices: S&P 500,
Exchange: Nasdaq Nms - Global Market (US - USD)
Website: https://www.newellbrands.com/
Phone:
Common Stock
Manufacturing (
Plastics Products, Nec
 Click to Enlarge