| Date | Price $ | Result % | Candle Name | Side |
|---|---|---|---|---|
| 001 26 Feb 2024 | Sell Price: 52.49 | Profit: Close Day1 ($ 52.31) | Engulfing | Sell |
| 002 31 Jan 2024 | Sell Price: 54.39 | Profit: Close Day2 ($ 54.19) | Engulfing | Sell |
| 003One Year Average | Both Sides Result for 2 Signals |
Profit: $ 0.38 ($ 0.19 / Signal) |
All of Them | Buy + Sell |
| Simple Moving Averages (SMA) Period | Value $ | Signal | Exponential Moving Averages (EMA) Period | Value $ | Signal | |
|---|---|---|---|---|---|---|
| 2 | 51.66 | BUY | 2 | 51.76 | BUY | |
| 3 | 51.37 | BUY | 3 | 51.68 | BUY | |
| 5 | 51.56 | BUY | 5 | 51.75 | BUY | |
| 8 | 52.07 | SELL | 8 | 51.94 | BUY | |
| 13 | 52.42 | SELL | 13 | 52.18 | SELL | |
| 21 | 52.60 | SELL | 21 | 52.37 | SELL | |
| 34 | 52.51 | SELL | 34 | 52.60 | SELL | |
| 55 | 52.63 | SELL | 55 | 52.95 | SELL | |
| 90 | 54.31 | SELL | 90 | 53.41 | SELL | |
| 200 | 54.54 | SELL | 200 | 55.07 | SELL |
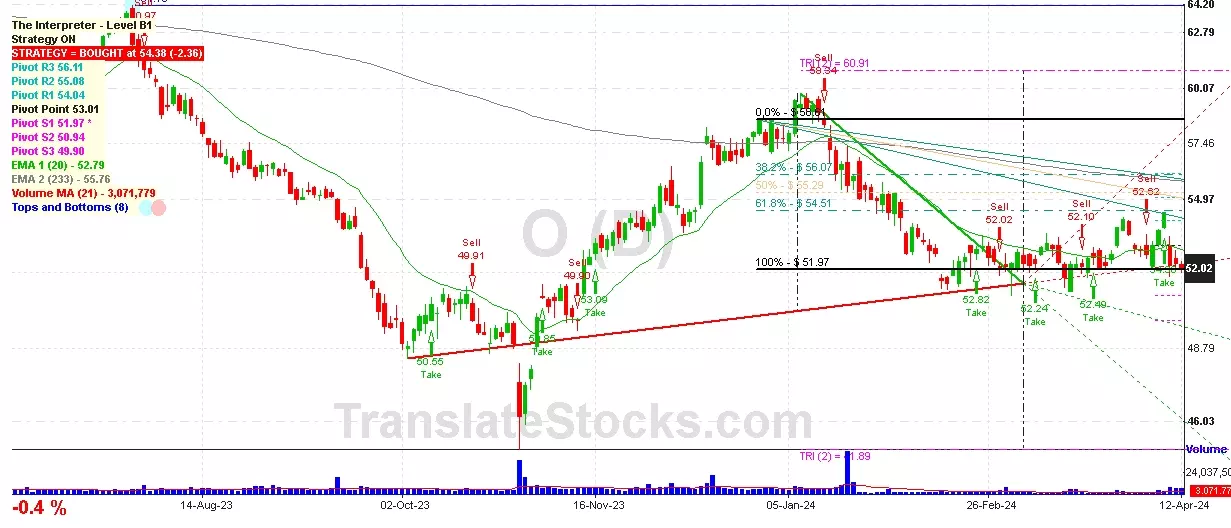
Realty Income Corp
IPO: 2012-02-10
Ticker: OIndices: S&P 500,
Exchange: New York Stock Exchange, Inc. (US - USD)
Website: https://www.realtyincome.com/Home/default.aspx
Phone:
REIT (Real Estate Investment Trust)
Real Estate & Construction (
Real Estate Investment Trusts

 Click to Enlarge