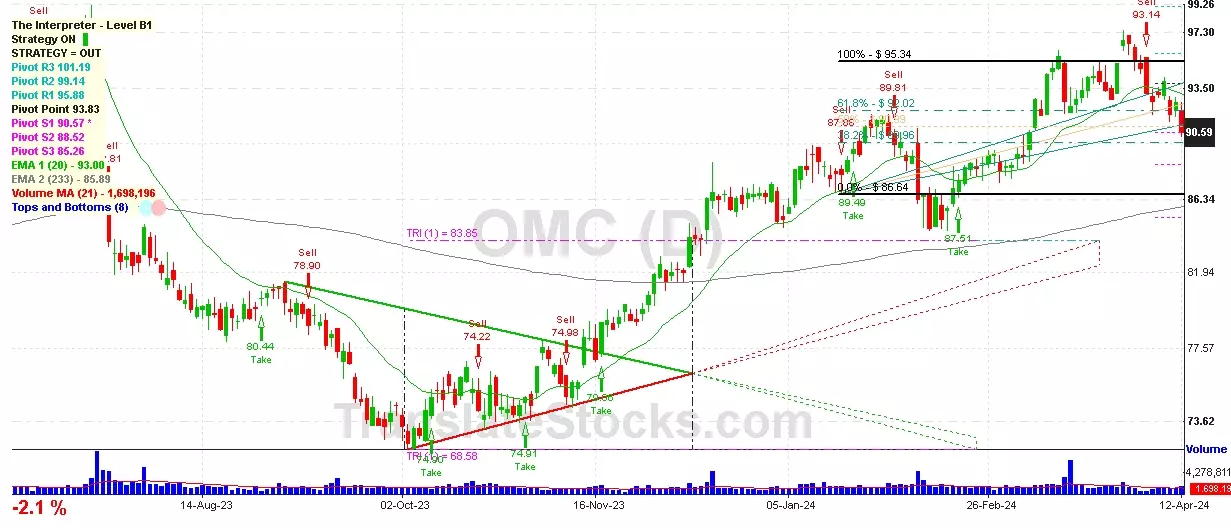
Hey Friend, I'm analysing OMNICOM GROUP (OMC), and it is between the Support of $ 90.57 (PivotS1) and the Resistance of $ 90.99 (50% of Fibonacci). The stock is also approaching the line of PivotS1 at $ 90.57, and if it goes below this line it could reach the next Support of 38.2% of Fibonacci at $ 89.96.

| Date | Price $ | Result % | Candle Name | Side |
|---|---|---|---|---|
| 001 16 Apr 2024 | Buy Price: 90.96 | Profit: Open Day1 ($ 93.35) | Piercing Line | Buy |
| 002 01 Apr 2024 | Sell Price: 96.58 | Profit: Open Day1 ($ 96.30) | Dark Cloud Cover | Sell |
| 003 28 Feb 2024 | Sell Price: 88.10 | Loss: Close Day2 ($ 88.44) | Abandoned Baby | Sell |
| 004 06 Feb 2024 | Buy Price: 89.00 | Profit: Open Day1 ($ 89.90) | Piercing Line | Buy |
| 005 24 Jan 2024 | Sell Price: 89.15 | Loss: Close Day2 ($ 90.89) | Engulfing | Sell |
| 006 02 Jan 2024 | Buy Price: 87.25 | Loss: Close Day2 ($ 85.09) | Engulfing | Buy |
| 007 11 Dec 2023 | Buy Price: 84.05 | Profit: Open Day1 ($ 84.14) | Abandoned Baby | Buy |
| 008 27 Nov 2023 | Sell Price: 79.20 | Profit: Close Day1 ($ 79.14) | Abandoned Baby | Sell |
| 009 13 Oct 2023 | Sell Price: 74.55 | Loss: Close Day2 ($ 76.54) | Abandoned Baby | Sell |
| 010 15 Jun 2023 | Buy Price: 95.60 | Loss: Close Day2 ($ 93.65) | Engulfing | Buy |
| 011 14 Jun 2023 | Sell Price: 94.62 | Profit: Open Day1 ($ 94.53) | Engulfing | Sell |
| 012One Year Average | Both Sides Result for 11 Signals |
Loss: $ -4.37 ($ -0.40 / Signal) |
All of Them | Buy + Sell |
| Simple Moving Averages (SMA) Period | Value $ | Signal | Exponential Moving Averages (EMA) Period | Value $ | Signal | |
|---|---|---|---|---|---|---|
| 2 | 91.98 | SELL | 2 | 91.64 | SELL | |
| 3 | 91.64 | SELL | 3 | 91.62 | SELL | |
| 5 | 91.21 | BUY | 5 | 91.66 | SELL | |
| 8 | 91.79 | SELL | 8 | 91.91 | SELL | |
| 13 | 92.56 | SELL | 13 | 92.30 | SELL | |
| 21 | 93.36 | SELL | 21 | 92.48 | SELL | |
| 34 | 92.89 | SELL | 34 | 92.14 | SELL | |
| 55 | 90.98 | BUY | 55 | 91.10 | BUY | |
| 90 | 89.54 | BUY | 90 | 89.37 | BUY | |
| 200 | 84.20 | BUY | 200 | 86.60 | BUY |
Omnicom Group
IPO: 1990-06-27
Ticker: OMCIndices: S&P 500,
Exchange: New York Stock Exchange, Inc. (US - USD)
Website: http://www.omnicomgroup.com/
Phone:
Common Stock
Trade & Services (
Services-advertising Agencies
 Click to Enlarge