| Date | Price $ | Result % | Candle Name | Side |
|---|---|---|---|---|
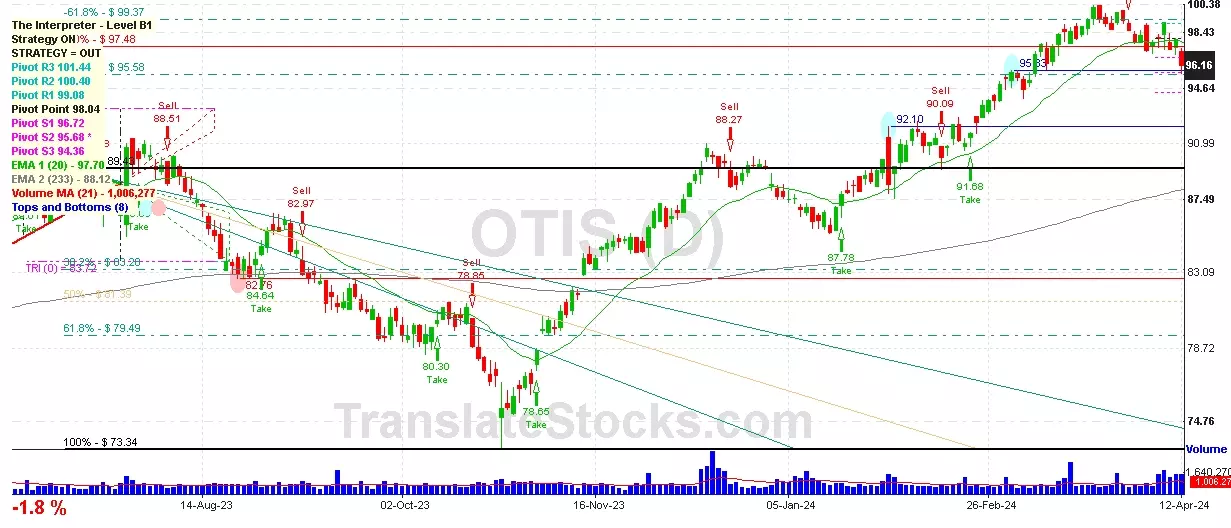
| 001 22 Mar 2024 | Sell Price: 99.34 | Profit: Close Day1 ($ 99.04) | Engulfing | Sell |
| 002 26 Jan 2024 | Sell Price: 88.63 | Profit: Open Day1 ($ 88.32) | Engulfing | Sell |
| 003 10 Jan 2024 | Buy Price: 87.00 | Loss: Close Day2 ($ 86.21) | Piercing Line | Buy |
| 004 26 Oct 2023 | Buy Price: 75.52 | Profit: Close Day1 ($ 76.14) | Abandoned Baby | Buy |
| 005 12 Oct 2023 | Sell Price: 80.41 | Profit: Close Day1 ($ 80.00) | Engulfing | Sell |
| 006 12 Oct 2023 | Sell Price: 80.44 | Profit: Close Day1 ($ 80.00) | Dark Cloud Cover | Sell |
| 007 03 Aug 2023 | Buy Price: 89.62 | Profit: Open Day1 ($ 89.90) | Engulfing | Buy |
| 008 07 Jul 2023 | Buy Price: 86.86 | Profit: Open Day1 ($ 86.97) | Piercing Line | Buy |
| 009 28 Jun 2023 | Sell Price: 87.51 | Profit: Open Day1 ($ 87.05) | Dark Cloud Cover | Sell |
| 010 20 Jun 2023 | Sell Price: 87.08 | Profit: Open Day1 ($ 86.73) | Abandoned Baby | Sell |
| 011 30 May 2023 | Sell Price: 81.23 | Profit: Open Day1 ($ 80.90) | Engulfing | Sell |
| 012 22 May 2023 | Sell Price: 84.08 | Profit: Open Day1 ($ 83.29) | Abandoned Baby | Sell |
| 013One Year Average | Both Sides Result for 12 Signals |
Profit: $ 3.60 ($ 0.30 / Signal) |
All of Them | Buy + Sell |
| Simple Moving Averages (SMA) Period | Value $ | Signal | Exponential Moving Averages (EMA) Period | Value $ | Signal | |
|---|---|---|---|---|---|---|
| 2 | 96.11 | SELL | 2 | 96.28 | SELL | |
| 3 | 96.73 | SELL | 3 | 96.55 | SELL | |
| 5 | 97.32 | SELL | 5 | 96.94 | SELL | |
| 8 | 97.45 | SELL | 8 | 97.30 | SELL | |
| 13 | 97.94 | SELL | 13 | 97.59 | SELL | |
| 21 | 98.34 | SELL | 21 | 97.51 | SELL | |
| 34 | 97.51 | SELL | 34 | 96.75 | SELL | |
| 55 | 95.03 | BUY | 55 | 95.19 | BUY | |
| 90 | 92.33 | BUY | 90 | 92.94 | BUY | |
| 200 | 87.58 | BUY | 200 | 88.90 | BUY |
Otis Worldwide Corp
IPO: 2020-03-18
Ticker: OTISIndices: S&P 500,
Exchange: New York Stock Exchange, Inc. (US - USD)
Website: https://www.otis.com/
Phone:
Common Stock
Manufacturing (
Electronic & Other Electrical Equipment (no Computer Equip)

 Click to Enlarge