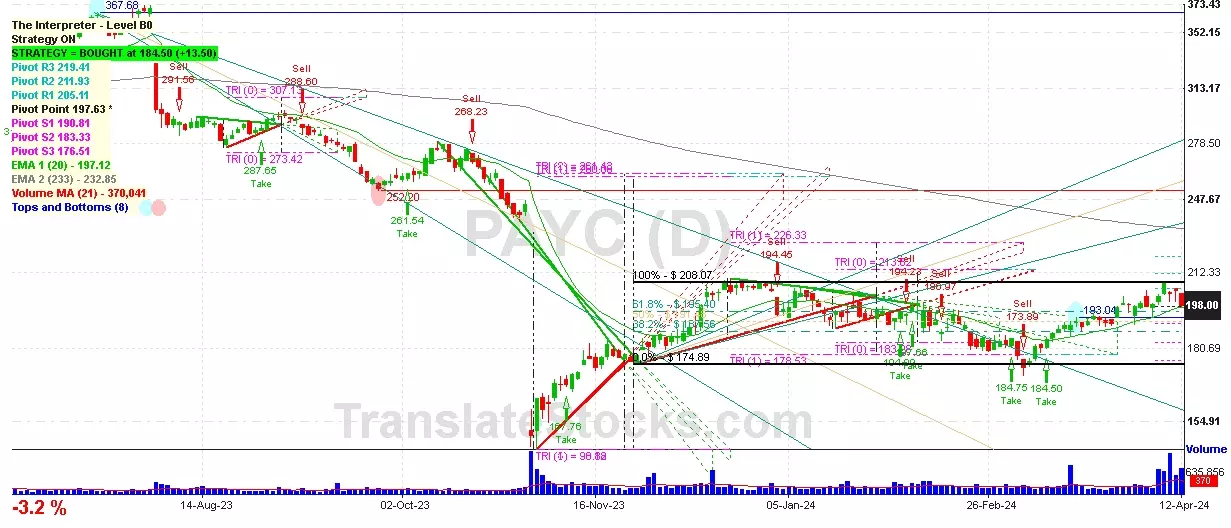
Hey Friend, I'm analysing PAYCOM SOFTWARE INC (PAYC), and it is between the Support of $ 197.63 (Pivot) and the Resistance of $ 205.11 (PivotR1). The stock is also approaching the line of Pivot at $ 197.63, and if it goes below this line it could reach the next Support of 61.8% of Fibonacci at $ 195.40.

| Date | Price $ | Result % | Candle Name | Side |
|---|---|---|---|---|
| 001 01 Apr 2024 | Sell Price: 198.28 | Profit: Open Day1 ($ 192.00) | Abandoned Baby | Sell |
| 002 19 Mar 2024 | Sell Price: 189.58 | Loss: Close Day2 ($ 193.53) | Abandoned Baby | Sell |
| 003 01 Mar 2024 | Buy Price: 184.75 | Loss: Close Day2 ($ 173.89) | Engulfing | Buy |
| 004 10 Jan 2024 | Sell Price: 202.00 | Profit: Close Day1 ($ 200.29) | Dark Cloud Cover | Sell |
| 005 04 Oct 2023 | Sell Price: 258.77 | Loss: Close Day2 ($ 270.28) | Engulfing | Sell |
| 006 19 Sep 2023 | Buy Price: 276.91 | Profit: Open Day1 ($ 278.15) | Engulfing | Buy |
| 007 19 Sep 2023 | Buy Price: 276.89 | Profit: Open Day1 ($ 278.15) | Piercing Line | Buy |
| 008 05 Sep 2023 | Sell Price: 294.12 | Profit: Open Day1 ($ 293.00) | Abandoned Baby | Sell |
| 009 30 May 2023 | Sell Price: 279.82 | Profit: Open Day1 ($ 277.59) | Engulfing | Sell |
| 010 23 May 2023 | Sell Price: 283.97 | Profit: Open Day1 ($ 281.35) | Abandoned Baby | Sell |
| 011One Year Average | Both Sides Result for 10 Signals |
Loss: $ -9.86 ($ -0.99 / Signal) |
All of Them | Buy + Sell |
| Simple Moving Averages (SMA) Period | Value $ | Signal | Exponential Moving Averages (EMA) Period | Value $ | Signal | |
|---|---|---|---|---|---|---|
| 2 | 187.40 | BUY | 2 | 187.35 | BUY | |
| 3 | 186.02 | BUY | 3 | 187.07 | BUY | |
| 5 | 185.96 | BUY | 5 | 187.67 | BUY | |
| 8 | 188.83 | SELL | 8 | 189.32 | SELL | |
| 13 | 194.34 | SELL | 13 | 191.22 | SELL | |
| 21 | 195.10 | SELL | 21 | 192.18 | SELL | |
| 34 | 192.16 | SELL | 34 | 192.25 | SELL | |
| 55 | 190.32 | SELL | 55 | 192.93 | SELL | |
| 90 | 193.82 | SELL | 90 | 197.84 | SELL | |
| 200 | 231.12 | SELL | 200 | 222.54 | SELL |
Paycom Software Inc
IPO: 2014-04-15
Ticker: PAYCIndices: S&P 500,
Exchange: New York Stock Exchange, Inc. (US - USD)
Website: http://www.paycom.com/
Phone:
Common Stock
Technology (
Services-prepackaged Software
 Click to Enlarge