| Date | Price $ | Result % | Candle Name | Side |
|---|---|---|---|---|
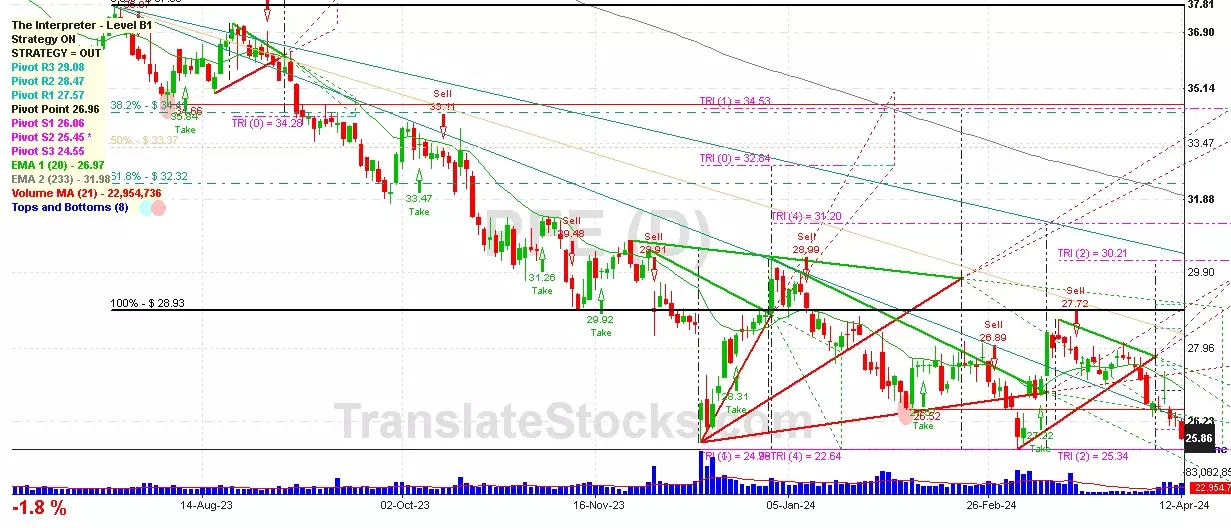
| 001 10 Apr 2024 | Sell Price: 26.32 | Profit: Open Day2 ($ 26.25) | Abandoned Baby | Sell |
| 002 28 Mar 2024 | Sell Price: 27.75 | Profit: Close Day1 ($ 27.72) | Engulfing | Sell |
| 003 28 Mar 2024 | Sell Price: 27.75 | Profit: Close Day1 ($ 27.72) | Dark Cloud Cover | Sell |
| 004 26 Feb 2024 | Sell Price: 27.18 | Profit: Open Day1 ($ 27.12) | Abandoned Baby | Sell |
| 005 23 Feb 2024 | Buy Price: 27.76 | Loss: Close Day2 ($ 26.89) | Abandoned Baby | Buy |
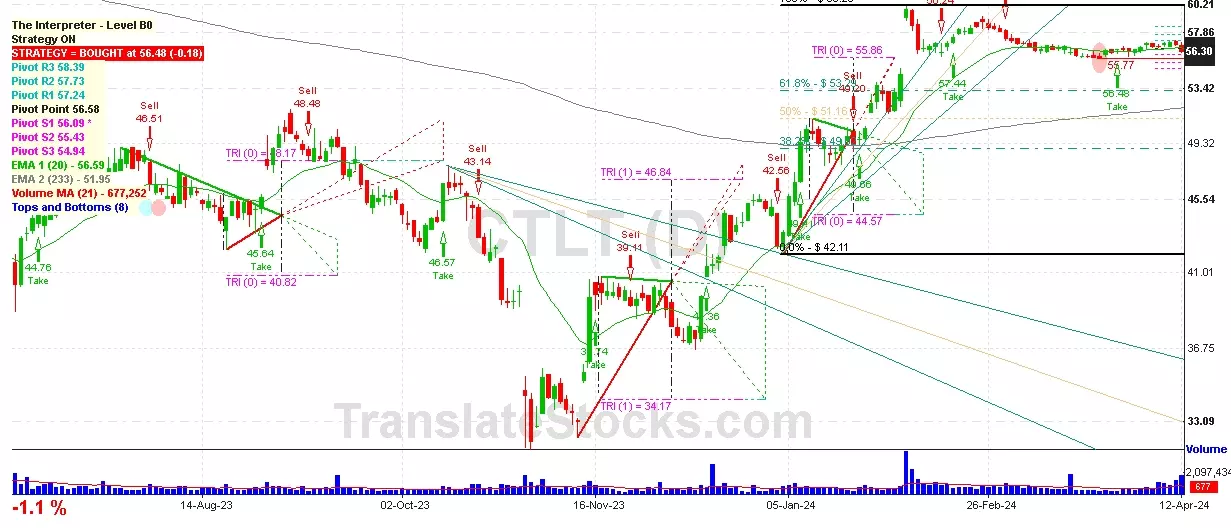
| 006 29 Sep 2023 | Buy Price: 33.17 | Profit: Close Day1 ($ 33.94) | Abandoned Baby | Buy |
| 007 05 Sep 2023 | Sell Price: 35.38 | Profit: Open Day1 ($ 35.26) | Engulfing | Sell |
| 008 26 Jul 2023 | Buy Price: 37.21 | Loss: Close Day2 ($ 36.07) | Piercing Line | Buy |
| 009 25 Jul 2023 | Sell Price: 37.06 | Profit: Open Day1 ($ 36.87) | Abandoned Baby | Sell |
| 010 09 Jun 2023 | Sell Price: 38.97 | Loss: Close Day2 ($ 40.28) | Engulfing | Sell |
| 011 02 May 2023 | Sell Price: 39.06 | Profit: Close Day1 ($ 38.45) | Dark Cloud Cover | Sell |
| 012 21 Apr 2023 | Buy Price: 40.21 | Loss: Close Day2 ($ 39.33) | Abandoned Baby | Buy |
| 013One Year Average | Both Sides Result for 12 Signals |
Loss: $ -2.32 ($ -0.19 / Signal) |
All of Them | Buy + Sell |
| Simple Moving Averages (SMA) Period | Value $ | Signal | Exponential Moving Averages (EMA) Period | Value $ | Signal | |
|---|---|---|---|---|---|---|
| 2 | 25.56 | SELL | 2 | 25.54 | SELL | |
| 3 | 25.67 | SELL | 3 | 25.64 | SELL | |
| 5 | 25.84 | SELL | 5 | 25.82 | SELL | |
| 8 | 26.11 | SELL | 8 | 26.06 | SELL | |
| 13 | 26.52 | SELL | 13 | 26.36 | SELL | |
| 21 | 26.93 | SELL | 21 | 26.66 | SELL | |
| 34 | 27.07 | SELL | 34 | 26.93 | SELL | |
| 55 | 27.16 | SELL | 55 | 27.29 | SELL | |
| 90 | 27.62 | SELL | 90 | 28.02 | SELL | |
| 200 | 30.85 | SELL | 200 | 30.95 | SELL |
Pfizer Inc
IPO: 1944-01-17
Ticker: PFEIndices: S&P 500,
Exchange: New York Stock Exchange, Inc. (US - USD)
Website: https://www.pfizer.com/
Phone:
Common Stock
Life Sciences (
Pharmaceutical Preparations
Year | 2020 | 2019 | 2018 | 2017 | 2016 | 2015 | 2014 | 2013 | 2012 | 2011 | 2010 | 2009 | 2008 | 2007 | 2006 | |
|---|---|---|---|---|---|---|---|---|---|---|---|---|---|---|---|---|
| 1 | Assets + | 154,229 | 167,489 | 159,422 | 171,797 | 171,615 | 167,460 | 169,274 | 172,101 | 185,798 | 188,002 | 195,014 | 212,949 | 111,148 | 3,406 | 1,827 |
| 2 | Real Estate Investment Property + | 0 | 0 | 0 | 0 | 0 | 0 | 0 | 557 | 597 | 737 | 803 | 937 | 0 | 0 | 0 |
| 3 | Real Estate Investment Property + | 0 | 0 | 0 | 0 | 0 | 0 | 0 | 557 | 597 | 737 | 803 | 937 | 0 | 0 | 0 |
| 4 | Investments in and Advance to Affiliates + | 16,856 | 17,133 | 181 | 0 | 270 | 0 | 0 | 0 | 0 | 0 | 0 | 0 | 0 | 0 | 0 |
| 5 | Cash and Cash Equivalents + | 1,784 | 1,305 | 1,139 | 1,342 | 2,595 | 3,641 | 3,343 | 2,183 | 10,389 | 3,182 | 1,735 | 1,978 | 2,122 | 3,406 | 1,827 |
| 6 | Property + | 13,900 | 13,967 | 13,385 | 13,865 | 13,318 | 13,766 | 11,762 | 12,397 | 14,461 | 15,921 | 17,607 | 22,780 | 13,287 | 0 | 0 |
| 7 | Property + | 28,711 | 30,756 | 29,977 | 30,037 | 28,125 | 27,268 | 24,988 | 25,678 | 27,882 | 29,237 | 32,298 | 33,924 | 0 | 0 | 0 |
| 8 | Intangible Assets + | 28,471 | 35,370 | 35,211 | 48,741 | 52,648 | 40,356 | 35,166 | 39,385 | 46,013 | 51,184 | 57,558 | 68,015 | 17,721 | 0 | 0 |
| 9 | Finite-Lived Intangible Assets + | 23,896 | 26,387 | 31,045 | 36,562 | 35,664 | 32,165 | 27,506 | 31,558 | 37,427 | 42,218 | 43,829 | 49,549 | 0 | 0 | 0 |
| 10 | Liabilities and Equity + | 154,229 | 167,489 | 159,422 | 171,797 | 171,615 | 167,460 | 169,274 | 172,101 | 185,798 | 188,002 | 195,014 | 212,949 | 111,148 | 65,124 | 71,432 |
| 11 | Liabilities + | 90,756 | 104,042 | 95,664 | 100,141 | 111,776 | 102,463 | 97,652 | 95,481 | 104,120 | 105,381 | 106,749 | 122,503 | 53,408 | 0 | 0 |
| 12 | Debt and Lease Obligation + | 701 | 14,775 | 4,066 | 6,420 | 6,473 | 0 | 0 | 3,000 | 2,700 | 0 | 0 | 0 | 0 | 0 | 0 |
| 13 | Stockholders' Equity + | 63,473 | 63,447 | 63,758 | 71,656 | 59,840 | 64,998 | 71,622 | 76,620 | 81,678 | 82,621 | 88,265 | 90,446 | 57,740 | 65,124 | 71,432 |
| 14 | Stockholders' Equity Attributable to Parent + | 63,238 | 63,143 | 63,407 | 71,308 | 59,544 | 64,720 | 71,301 | 76,307 | 81,260 | 82,190 | 87,813 | 90,014 | 57,556 | 0 | 0 |
| 15 | Stockholders' Equity + | 0.05 | 0.05 | 0.05 | 0.05 | 0.05 | 0.05 | 0.05 | 0.05 | 0.05 | 0.05 | 0.05 | 0.05 | 0.05 | 0 | 0 |
| 16 | Preferred Stock + | 0 | 0 | 0 | 0 | 0 | 0 | 0 | 0 | 0 | 0 | 0 | 0 | 0 | 0 | 0 |
| 17 | Common Stock + | 0.05 | 0.05 | 0.05 | 0.05 | 0.05 | 0.05 | 0.05 | 0.05 | 0.05 | 0.05 | 0.05 | 0.05 | 0.05 | 0 | 0 |
| 18 | Partners' Capital + | 96,770 | 97,670 | 89,554 | 85,291 | 71,774 | 71,993 | 72,176 | 69,732 | 54,240 | 46,210 | 42,716 | 40,426 | 49,142 | 0 | 0 |
| 19 | Partners' Capital + | 96,770 | 97,670 | 89,554 | 85,291 | 71,774 | 71,993 | 72,176 | 69,732 | 54,240 | 46,210 | 42,716 | 40,426 | 49,142 | 0 | 0 |
| 20 | Limited Liability Company (LLC) Members' Equity + | 85,082 | 86,030 | 78,279 | 75,970 | 60,738 | 62,471 | 64,860 | 66,461 | 48,287 | 42,081 | 39,276 | 40,978 | 44,573 | 0 | 0 |
| 21 | Limited Liability Company (LLC) Members' Equity + | 85,082 | 86,030 | 78,279 | 75,970 | 60,738 | 62,471 | 64,860 | 66,461 | 48,287 | 42,081 | 39,276 | 40,978 | 44,573 | 0 | 0 |
| 22 | Current Assets + | 35,067 | 32,803 | 49,926 | 41,141 | 38,949 | 43,804 | 57,702 | 56,244 | 61,415 | 60,817 | 60,468 | 61,670 | 43,076 | 0 | 0 |
| 23 | Cash + | 11,004 | 8,525 | 17,694 | 18,650 | 15,255 | 19,649 | 32,779 | 30,225 | 22,319 | 23,270 | 26,277 | 23,991 | 21,609 | 0 | 0 |
| 24 | Current Receivables + | 7,930 | 8,724 | 8,025 | 8,221 | 8,225 | 8,176 | 8,669 | 9,357 | 12,378 | 13,109 | 15,079 | 15,840 | 9,782 | 0 | 0 |
| 25 | Inventory + | 8,046 | 8,283 | 7,508 | 7,578 | 6,783 | 7,513 | 5,663 | 6,166 | 7,063 | 6,610 | 8,405 | 12,403 | 4,381 | 0 | 0 |
| 26 | Current Disposal Group + | 167 | 21 | 9,725 | 12 | 801 | 9 | 0 | 0 | 1,472 | 550 | 0 | 0 | 0 | 0 | 0 |
| 27 | Long-Term Assets + | 55,539 | 64,416 | 56,210 | 59,179 | 57,772 | 51,741 | 45,582 | 46,115 | 47,905 | 44,569 | 43,432 | 42,376 | 21,464 | 0 | 0 |
| 28 | Long-term Investments and Receivables + | 20,262 | 3,014 | 2,767 | 7,015 | 7,116 | 15,999 | 17,518 | 16,406 | 14,149 | 9,457 | 9,748 | 13,122 | 11,478 | 0 | 0 |
| 29 | Long-Term Disposal Group + | 0 | 13,427 | 0 | 0 | 0 | 0 | 0 | 0 | 139 | 0 | 0 | 0 | 0 | 0 | 0 |
| 30 | Current Liabilities + | 25,920 | 37,304 | 31,858 | 30,427 | 31,115 | 29,399 | 21,631 | 23,366 | 28,619 | 28,909 | 28,609 | 37,225 | 27,009 | 0 | 0 |
| 31 | Long-Term Other Undisclosed Liabilities | 0 | 0 | 0 | 0 | 0 | 34,997 | 35,244 | 0 | 0 | 26,791 | 27,884 | 27,474 | 8,798 | 0 | 0 |
| 32 | Long-Term Liabilities + | 61,105 | 61,575 | 57,904 | 62,284 | 72,488 | 73,064 | 76,021 | 39,222 | 50,465 | 76,472 | 78,140 | 85,278 | 26,399 | 0 | 0 |
| 33 | Increase (Decrease) in Stockholders' Equity [Roll Forward] + | -110,988 | -110,801 | -101,610 | -89,425 | -84,364 | -79,252 | -73,021 | -67,923 | -40,121 | -31,801 | -22,712 | -21,632 | -57,391 | 0 | 0 |
| 34 | Treasury Stock Transactions + | -110,988 | -110,801 | -101,610 | -89,425 | -84,364 | -79,252 | -73,021 | -67,923 | -40,121 | -31,801 | -22,712 | -21,632 | -57,391 | 0 | 0 |
| 35 | Treasury Stock + | -110,988 | -110,801 | -101,610 | -89,425 | -84,364 | -79,252 | -73,021 | -67,923 | -40,121 | -31,801 | -22,712 | -21,632 | -57,391 | 0 | 0 |
| 36 | Current Other Assets + | 3,438 | 2,600 | 2,461 | 2,289 | 2,249 | 2,163 | 2,750 | 3,613 | 3,567 | 0 | 0 | 0 | 0 | 0 | 0 |
| 37 | Total Current Assets + | 35,067 | 32,803 | 49,926 | 41,141 | 38,949 | 43,804 | 57,702 | 56,244 | 61,415 | 60,817 | 60,468 | 61,670 | 43,076 | 0 | 0 |
| 38 | Long-Term Inventory + | 890 | 714 | 618 | 683 | 683 | 594 | 425 | 463 | 761 | 800 | 0 | 0 | 0 | 0 | 0 |
| 39 | Operating Lease + | 1,393 | 1,313 | 0 | 0 | 0 | 0 | 0 | 0 | 0 | 0 | 0 | 0 | 0 | 0 | 0 |
| 40 | Goodwill + | 49,577 | 58,653 | 53,411 | 55,952 | 54,449 | 48,242 | 42,069 | 42,519 | 44,672 | 44,569 | 43,432 | 42,376 | 21,464 | 0 | 0 |
| 41 | Long-Term Other Assets + | 4,569 | 4,450 | 2,799 | 3,227 | 3,323 | 3,499 | 3,513 | 3,596 | 3,233 | 0 | 0 | 0 | 0 | 0 | 0 |
| 42 | Total Assets + | 154,229 | 167,489 | 159,422 | 171,797 | 171,615 | 167,460 | 169,274 | 172,101 | 185,798 | 188,002 | 195,014 | 212,949 | 111,148 | 0 | 0 |
| 43 | Total Liabilities + | 90,756 | 104,042 | 95,664 | 100,141 | 111,776 | 102,463 | 97,652 | 95,481 | 104,120 | 105,381 | 106,749 | 122,503 | 53,408 | 0 | 0 |
| 44 | Stockholders' Equity Attributable to Noncontrolling Interest + | 235 | 303 | 351 | 348 | 296 | 278 | 321 | 313 | 418 | 431 | 452 | 432 | 184 | 0 | 0 |
| 45 | Total Stockholders' Equity + | 63,473 | 63,447 | 63,758 | 71,656 | 59,840 | 64,998 | 71,622 | 76,620 | 81,678 | 82,621 | 88,265 | 90,446 | 57,740 | 65,124 | 71,432 |
| 46 | Total Liabilities and Equity + | 154,229 | 167,489 | 159,422 | 171,797 | 171,615 | 167,460 | 169,274 | 172,101 | 185,798 | 188,002 | 195,014 | 212,949 | 111,148 | 0 | 0 |
Year | 2020 | 2019 | 2018 | 2017 | 2016 | 2015 | 2014 | 2013 | 2012 | 2011 | 2010 | 2009 | 2008 | 2007 | |
|---|---|---|---|---|---|---|---|---|---|---|---|---|---|---|---|
| 1 | -8,692 | -10,219 | -11,248 | -11,228 | -12,322 | 0 | 0 | -9,586 | -11,334 | -14,076 | -14,788 | -8,888 | -8,112 | -11,239 | |
| 2 | 9,405 | 8,650 | 8,006 | 7,657 | 7,872 | 7,690 | 8,393 | 6,678 | 7,870 | 9,074 | 9,483 | 7,845 | 7,945 | 8,089 | |
| 3 | 0 | 0 | 0 | 0 | 0 | 0 | 0 | 0 | 0 | 0 | 9,608 | 7,913 | 8,578 | 8,372 | |
| 4 | 28 | 554 | 157 | 240 | 510 | 975 | 0 | -1,342 | 0 | 0 | 0 | 0 | 0 | 0 | |
| 5 | 62 | 865 | 417 | 545 | 951 | 1,194 | 80 | -1,198 | 405 | 725 | 1,001 | 569 | 0 | 0 | |
| 6 | 0 | 815 | 0 | 0 | 0 | 0 | 0 | 0 | 0 | 0 | 0 | 0 | 0 | 0 | |
| 7 | 0 | 0 | 0 | 0 | 0 | 0 | 0 | -1,251 | 555 | 867 | 0 | 0 | 0 | 0 | |
| 8 | 11,615 | 14,350 | 14,455 | 14,784 | 14,837 | 14,809 | 14,097 | 14,355 | 16,616 | 18,832 | 18,973 | 14,875 | 14,537 | 15,626 | |
| 9 | 0 | 0 | 0 | 0 | 0 | 0 | 0 | 320 | 52 | 15 | 243 | 188 | 14 | 0 | |
| 10 | 0 | 0 | 60 | 52 | 0 | 0 | 0 | 0 | 0 | 0 | 0 | 0 | 0 | 0 | |
| 11 | 3 | -29 | 0 | 0 | 0 | 0 | 0 | 0 | 0 | 0 | 0 | 0 | 0 | 0 | |
| 12 | 240 | -60 | -71 | 45 | -51 | 0 | 0 | 0 | 0 | 0 | 0 | 0 | 0 | 0 | |
| 13 | 0 | 0 | 1 | -55 | -1,712 | 0 | 0 | 0 | 0 | -15 | 155 | 670 | 0 | 0 | |
| 14 | 770 | 648 | 495 | 499 | 905 | 0 | 0 | 0 | 0 | 0 | 0 | 0 | 0 | 0 | |
| 15 | 73 | 226 | 333 | 391 | 470 | 471 | 425 | 403 | 382 | 0 | 0 | 0 | 0 | 0 | |
| 16 | 0 | 0 | 0 | 0 | 0 | 0 | 0 | 0 | 383 | 456 | 400 | 746 | 1,288 | 0 | |
| 17 | 236 | -64 | 288 | -101 | -139 | 0 | 0 | 0 | 0 | 0 | 0 | 0 | 0 | 0 | |
| 18 | -669 | -3,578 | -2,116 | -1,315 | -3,655 | -2,860 | -1,009 | 532 | -139 | -139 | 147 | -67 | -48 | 0 | |
| 19 | 1,449 | 1,574 | 1,316 | 1,270 | 1,186 | 1,199 | 1,360 | 1,414 | 1,524 | 1,681 | 1,797 | 1,233 | 516 | 0 | |
| 20 | 0 | 138 | 3 | 999 | 312 | 0 | 0 | 0 | 0 | 0 | 0 | 0 | 0 | 0 | |
| 21 | 0 | 0 | 0 | 0 | 8,351 | 8,965 | 12,240 | 15,716 | 11,242 | 0 | 9,422 | 10,827 | 9,694 | 9,278 | |
| 22 | 0 | 0 | 0 | 0 | 0 | -45 | -86 | 0 | 0 | 0 | 0 | 0 | 0 | 0 | |
| 23 | 7,497 | 17,682 | 11,885 | 12,305 | 8,351 | 8,965 | 12,240 | 15,716 | 12,080 | 12,304 | 9,471 | 10,674 | 0 | 0 | |
| 24 | -477 | -1,384 | -706 | 9,049 | -1,123 | -1,990 | -3,120 | -4,306 | -2,562 | -3,909 | -1,153 | -2,197 | -1,645 | -1,023 | |
| 25 | 6,544 | 14,914 | 10,473 | 30,402 | 6,106 | 4,985 | 5,999 | 7,104 | 6,956 | 4,486 | 7,165 | 6,433 | 6,404 | 7,232 | |
| 26 | 0 | 0 | 0 | 0 | 0 | 20 | -9 | 408 | 414 | 487 | -50 | 0 | 0 | 0 | |
| 27 | 0 | 0 | 0 | 0 | 0 | 22 | -12 | 508 | 531 | 624 | -81 | 0 | 0 | 0 | |
| 28 | 0 | 4 | 10 | -1 | 16 | 17 | -6 | 308 | 297 | 350 | -19 | 97 | 0 | 0 | |
| 29 | 0 | 0 | 0 | 0 | 0 | -6 | 51 | 10,446 | 7,123 | 1,688 | -11 | 0 | 6 | -168 | |
| 30 | 0 | 0 | 0 | 0 | 0 | 0 | 47 | 10,538 | 9,463 | 2,072 | 0 | 0 | 0 | 0 | |
| 31 | 0 | 0 | 0 | 3 | 0 | -6 | 55 | 10,354 | 4,783 | 1,304 | -11 | 17 | 0 | 0 | |
| 32 | 0 | 0 | 0 | 0 | 0 | 0 | 0 | 0 | 7,123 | 1,688 | -11 | -15 | 0 | 0 | |
| 33 | 2,631 | 4 | 10 | 2 | 17 | 11 | 48 | 10,662 | 5,080 | 1,654 | -30 | 14 | 78 | -69 | |
| 34 | 9,652 | 16,302 | 11,188 | 21,355 | 7,246 | 6,986 | 9,168 | 22,072 | 14,598 | 10,049 | 8,288 | 8,644 | 8,127 | 8,186 | |
| 35 | -36 | -29 | -36 | -47 | -31 | -26 | -32 | -69 | -28 | -40 | -31 | -9 | -23 | -42 | |
| 36 | Total Net Income (Loss) Attributable to Parent + | 9,616 | 16,273 | 11,153 | 21,308 | 7,215 | 6,960 | 9,135 | 22,003 | 14,570 | 10,009 | 8,257 | 8,635 | 8,104 | 8,144 |
| 37 | Preferred Stock Dividends + | 0 | 1 | 1 | 1 | 1 | 1 | 1 | 2 | 2 | 0 | 0 | 0 | 0 | 0 |
| 38 | 9,616 | 16,272 | 11,152 | 21,307 | 7,214 | 6,959 | 9,134 | 22,001 | 14,568 | 10,007 | 8,255 | 8,633 | 8,101 | 0 | |
| 39 | Income (Loss) from Continuing Operations + | 7,021 | 16,298 | 11,179 | 21,353 | 7,229 | 6,975 | 9,119 | 11,410 | 9,518 | 8,395 | 8,318 | 8,630 | 8,049 | 8,255 |
| 40 | Income (Loss) from Continuing Operations + | 0 | 16,327 | 11,215 | 21,400 | 7,260 | 7,001 | 9,151 | 11,440 | 9,546 | 0 | 0 | 0 | 0 | 0 |
| 41 | Total Income (Loss) from Continuing Operations + | 14,006 | 32,596 | 22,358 | 42,706 | 14,458 | 13,950 | 18,238 | 22,820 | 19,036 | 16,750 | 16,605 | 17,251 | 16,075 | 0 |
| 42 | Income (Loss) from Discontinued Operations + | 2,631 | 4 | 10 | 2 | 17 | 11 | 48 | 10,662 | 5,080 | 1,654 | -30 | 14 | 78 | -69 |
| 43 | Income (Loss) from Discontinued Operations + | 0 | 0 | 0 | 0 | 0 | 0 | 0 | 10,701 | 0 | 0 | 0 | 0 | 0 | 0 |
| 44 | Total Income (Loss) from Discontinued Operations + | 2,631 | 4 | 10 | 2 | 17 | 11 | 48 | 10,623 | 5,577 | 2,189 | 0 | 0 | 0 | 0 |
| 45 | Income (Loss) from Continuing Operations + | 1.26 | 2.92 | 1.90 | 3.57 | 1.18 | 1.13 | 1.43 | 1.67 | 1.27 | 1.07 | 1.03 | 1.23 | 1.19 | 1.19 |
| 46 | 0.47 | 0.98 | 1.25 | 0 | 0 | 0 | 0.01 | 1.56 | 0.68 | 0.21 | 0.01 | 0.02 | 0.01 | -0.01 | |
| 47 | Total Earnings Per Share + | 1.73 | 2.92 | 1.90 | 3.57 | 1.18 | 1.13 | 1.44 | 3.23 | 1.96 | 1.28 | 1.03 | 1.23 | 1.20 | 1.18 |
| 48 | Income (Loss) from Continuing Operations + | 1.26 | 2.92 | 1.90 | 3.57 | 1.18 | 1.13 | 1.43 | 1.67 | 1.27 | 1.07 | 1.03 | 1.23 | 1.19 | 1.19 |
| 49 | Income (Loss) from Continuing Operations + | 1.24 | 2.87 | 1.86 | 3.52 | 1.17 | 1.11 | 1.41 | 1.65 | 1.26 | 1.06 | 1.03 | 1.23 | 1.19 | 1.18 |
| 50 | 0.47 | 0.96 | 1.23 | 0 | 0 | 0 | 0.01 | 1.54 | 0.68 | 0.21 | 0.01 | 0.02 | 0.01 | -0.01 | |
| 51 | Total Earnings Per Share + | 1.71 | 2.87 | 1.87 | 3.52 | 1.17 | 1.11 | 1.42 | 3.19 | 1.94 | 1.27 | 1.02 | 1.23 | 1.20 | 1.17 |
| 52 | 1.53 | 1.46 | 1.38 | 1.30 | 1.22 | 0.30 | 0 | 0 | 0 | 0 | 0 | 0 | 0 | 0 | |
| 53 | 0 | 0 | 0 | 2.58 | 2.42 | 1.42 | 1.04 | 0.96 | 0.88 | 0.80 | 0.72 | 0 | 0 | 0 |

 Click to Enlarge