Hey Friend, I'm analysing PROGRESSIVE CORP (PGR), and it is between the Support of $ 203.40 (PivotS2) and the Resistance of $ 207.20 (PivotS1). The stock is also approaching the line of PivotS2 at $ 203.40, and if it goes below this line it could reach the next Support of 200% of Fibonacci at $ 192.07.

| Date | Price $ | Result % | Candle Name | Side |
|---|---|---|---|---|
| 001 18 Dec 2023 | Buy Price: 156.00 | Profit: Close Day1 ($ 157.68) | Abandoned Baby | Buy |
| 002 14 Nov 2023 | Sell Price: 159.53 | Profit: Open Day1 ($ 159.28) | Abandoned Baby | Sell |
| 003 19 Oct 2023 | Sell Price: 157.80 | Profit: Close Day1 ($ 154.84) | Abandoned Baby | Sell |
| 004 11 Oct 2023 | Buy Price: 143.86 | Profit: Open Day1 ($ 144.37) | Engulfing | Buy |
| 005 18 Sep 2023 | Buy Price: 140.56 | Profit: Open Day1 ($ 141.37) | Abandoned Baby | Buy |
| 006 05 Sep 2023 | Sell Price: 133.52 | Loss: Close Day2 ($ 137.41) | Engulfing | Sell |
| 007 01 Jun 2023 | Buy Price: 128.33 | Profit: Open Day1 ($ 128.58) | Abandoned Baby | Buy |
| 008One Year Average | Both Sides Result for 7 Signals |
Profit: $ 2.57 ($ 0.37 / Signal) |
All of Them | Buy + Sell |
| Simple Moving Averages (SMA) Period | Value $ | Signal | Exponential Moving Averages (EMA) Period | Value $ | Signal | |
|---|---|---|---|---|---|---|
| 2 | 213.85 | SELL | 2 | 212.97 | BUY | |
| 3 | 212.48 | BUY | 3 | 212.39 | BUY | |
| 5 | 210.98 | BUY | 5 | 211.23 | BUY | |
| 8 | 208.46 | BUY | 8 | 210.10 | BUY | |
| 13 | 208.40 | BUY | 13 | 208.97 | BUY | |
| 21 | 208.06 | BUY | 21 | 207.27 | BUY | |
| 34 | 205.15 | BUY | 34 | 203.89 | BUY | |
| 55 | 198.25 | BUY | 55 | 197.99 | BUY | |
| 90 | 185.63 | BUY | 90 | 189.08 | BUY | |
| 200 | 162.06 | BUY | 200 | 170.47 | BUY |
Progressive Corp
IPO: 1987-06-01
Ticker: PGRIndices: S&P 500,
Exchange: New York Stock Exchange, Inc. (US - USD)
Website: https://www.progressive.com/
Phone:
Common Stock
Finance (
Fire, Marine & Casualty Insurance
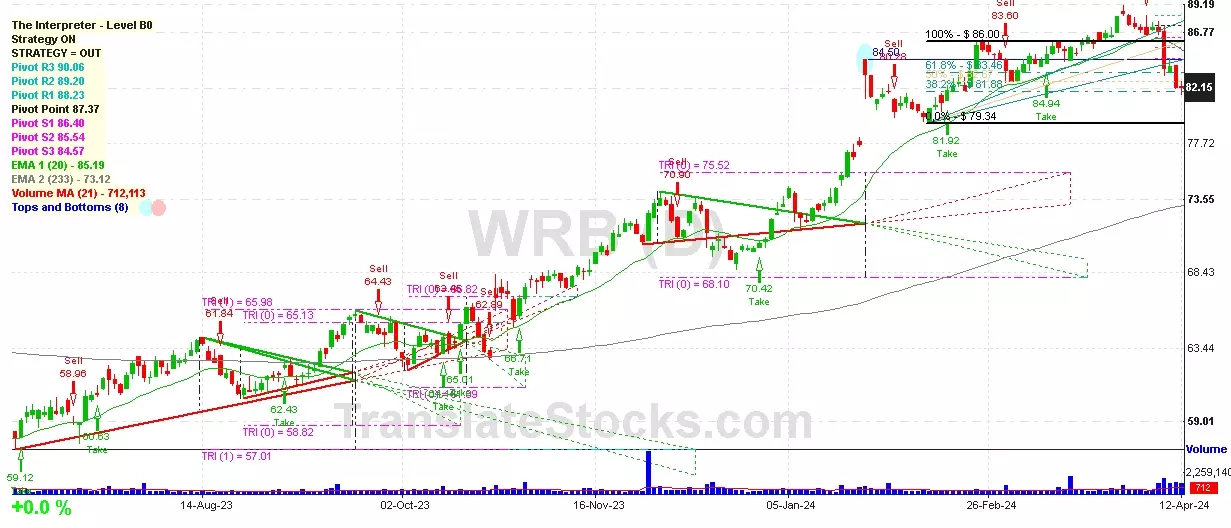
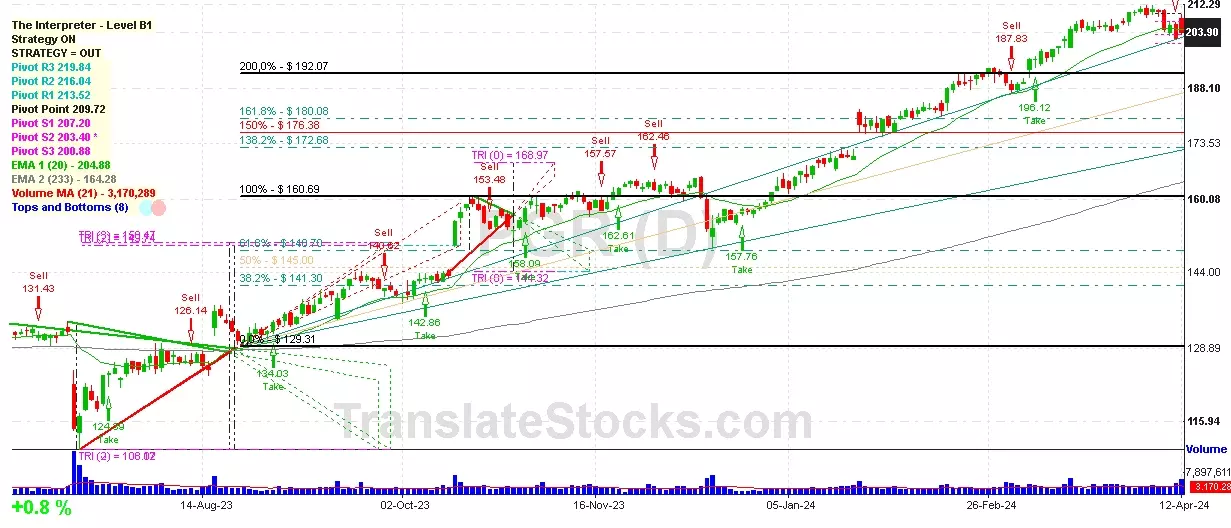 Click to Enlarge