| Date | Price $ | Result % | Candle Name | Side |
|---|---|---|---|---|
| 001 04 Apr 2024 | Sell Price: 555.65 | Profit: Open Day1 ($ 554.23) | Dark Cloud Cover | Sell |
| 002 18 Mar 2024 | Buy Price: 536.26 | Profit: Close Day1 ($ 538.84) | Abandoned Baby | Buy |
| 003 29 Feb 2024 | Buy Price: 535.45 | Profit: Open Day1 ($ 535.46) | Abandoned Baby | Buy |
| 004 27 Feb 2024 | Buy Price: 531.49 | Profit: Open Day2 ($ 531.89) | Abandoned Baby | Buy |
| 005 26 Jan 2024 | Sell Price: 471.59 | Profit: Open Day1 ($ 470.79) | Engulfing | Sell |
| 006 23 Jan 2024 | Sell Price: 469.10 | Profit: Close Day1 ($ 464.88) | Engulfing | Sell |
| 007 08 Dec 2023 | Buy Price: 438.63 | Profit: Open Day2 ($ 439.43) | Engulfing | Buy |
| 008 08 Sep 2023 | Buy Price: 409.34 | Profit: Open Day1 ($ 411.91) | Abandoned Baby | Buy |
| 009 08 Sep 2023 | Buy Price: 409.20 | Profit: Open Day1 ($ 411.91) | Piercing Line | Buy |
| 010 05 Sep 2023 | Sell Price: 411.67 | Profit: Open Day1 ($ 408.63) | Engulfing | Sell |
| 011 12 Jul 2023 | Sell Price: 397.09 | Profit: Close Day2 ($ 396.20) | Dark Cloud Cover | Sell |
| 012 16 Jun 2023 | Sell Price: 369.10 | Profit: Open Day1 ($ 366.08) | Engulfing | Sell |
| 013 30 May 2023 | Sell Price: 330.25 | Profit: Open Day1 ($ 328.32) | Dark Cloud Cover | Sell |
| 014 27 Apr 2023 | Buy Price: 323.30 | Profit: Open Day1 ($ 324.07) | Abandoned Baby | Buy |
| 015One Year Average | Both Sides Result for 14 Signals |
Profit: $ 25.16 ($ 1.80 / Signal) |
All of Them | Buy + Sell |
| Simple Moving Averages (SMA) Period | Value $ | Signal | Exponential Moving Averages (EMA) Period | Value $ | Signal | |
|---|---|---|---|---|---|---|
| 2 | 548.38 | SELL | 2 | 546.38 | SELL | |
| 3 | 545.49 | BUY | 3 | 545.45 | BUY | |
| 5 | 541.84 | BUY | 5 | 544.55 | BUY | |
| 8 | 542.16 | BUY | 8 | 544.97 | BUY | |
| 13 | 548.16 | SELL | 13 | 546.28 | BUY | |
| 21 | 550.88 | SELL | 21 | 546.52 | SELL | |
| 34 | 547.60 | SELL | 34 | 542.82 | BUY | |
| 55 | 538.92 | BUY | 55 | 532.04 | BUY | |
| 90 | 510.33 | BUY | 90 | 512.07 | BUY | |
| 200 | 452.57 | BUY | 200 | 462.76 | BUY |
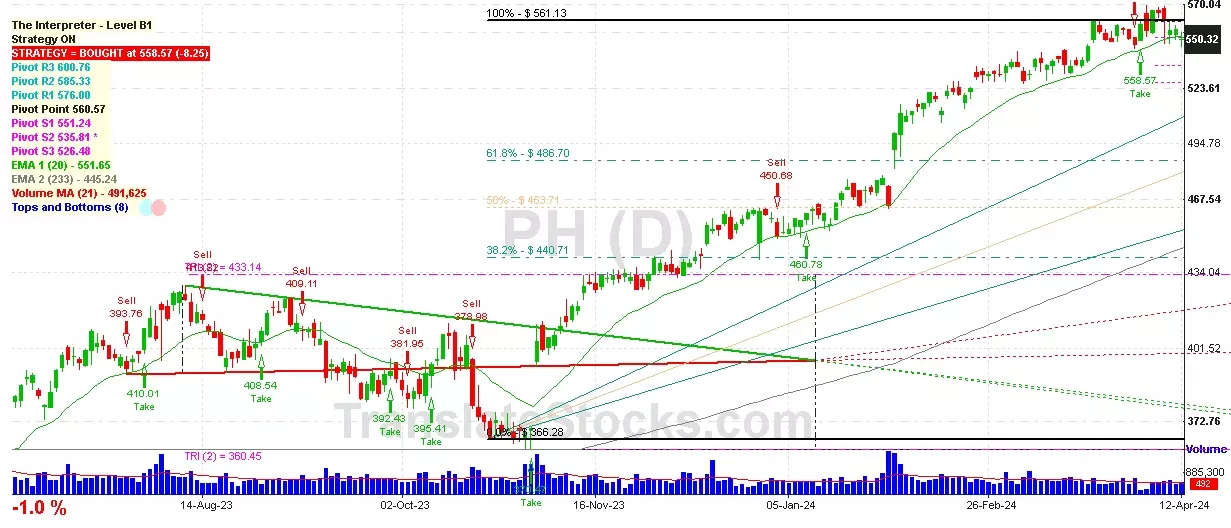
Parker Hannifin Corp
IPO: 1964-12-09
Ticker: PHIndices: S&P 500,
Exchange: New York Stock Exchange, Inc. (US - USD)
Website: https://www.parker.com
Phone:
Common Stock
Manufacturing (
Miscellaneous Fabricated Metal Products

 Click to Enlarge