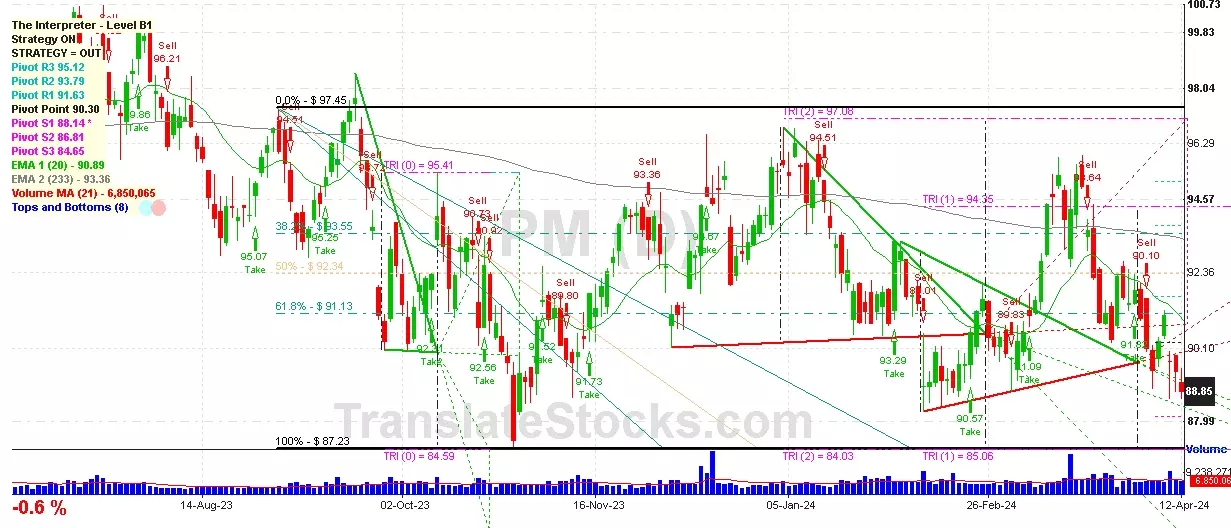
Hey Friend, I'm analysing PHILIP MORRIS INTERNATIONAL (PM), and it is between the Support of $ 88.14 (PivotS1) and the Resistance of $ 90.30 (Pivot). The stock is also approaching the line of PivotS1 at $ 88.14, and if it goes below this line it could reach the next Support of 100% of Fibonacci at $ 87.23.

| Date | Price $ | Result % | Candle Name | Side |
|---|---|---|---|---|
| 001 14 Mar 2024 | Sell Price: 93.95 | Profit: Open Day1 ($ 92.77) | Abandoned Baby | Sell |
| 002 07 Dec 2023 | Buy Price: 91.12 | Profit: Open Day1 ($ 91.33) | Abandoned Baby | Buy |
| 003 01 Dec 2023 | Buy Price: 94.05 | Loss: Close Day2 ($ 92.54) | Engulfing | Buy |
| 004 29 Nov 2023 | Sell Price: 93.65 | Profit: Close Day1 ($ 93.36) | Engulfing | Sell |
| 005 06 Nov 2023 | Sell Price: 90.97 | Profit: Close Day2 ($ 90.20) | Engulfing | Sell |
| 006 20 Oct 2023 | Buy Price: 92.56 | Loss: Close Day2 ($ 90.83) | Engulfing | Buy |
| 007 31 Aug 2023 | Sell Price: 96.06 | Profit: Close Day1 ($ 95.68) | Engulfing | Sell |
| 008 05 Jul 2023 | Sell Price: 97.45 | Profit: Open Day1 ($ 96.48) | Abandoned Baby | Sell |
| 009 20 Jun 2023 | Sell Price: 94.82 | Loss: Close Day2 ($ 95.69) | Dark Cloud Cover | Sell |
| 010 15 May 2023 | Sell Price: 95.00 | Profit: Open Day1 ($ 94.71) | Engulfing | Sell |
| 011One Year Average | Both Sides Result for 10 Signals |
Loss: $ -0.02 ($ -0.00 / Signal) |
All of Them | Buy + Sell |
| Simple Moving Averages (SMA) Period | Value $ | Signal | Exponential Moving Averages (EMA) Period | Value $ | Signal | |
|---|---|---|---|---|---|---|
| 2 | 98.34 | BUY | 2 | 98.12 | BUY | |
| 3 | 96.91 | BUY | 3 | 97.20 | BUY | |
| 5 | 95.14 | BUY | 5 | 95.73 | BUY | |
| 8 | 93.05 | BUY | 8 | 94.33 | BUY | |
| 13 | 91.83 | BUY | 13 | 93.17 | BUY | |
| 21 | 91.52 | BUY | 21 | 92.47 | BUY | |
| 34 | 92.26 | BUY | 34 | 92.11 | BUY | |
| 55 | 91.47 | BUY | 55 | 92.01 | BUY | |
| 90 | 92.28 | BUY | 90 | 92.16 | BUY | |
| 200 | 93.26 | BUY | 200 | 93.07 | BUY |
Philip Morris International
IPO: 2008-03-17
Ticker: PMIndices: S&P 500,
Exchange: New York Stock Exchange, Inc. (US - USD)
Website: https://www.pmi.com/
Phone:
Common Stock
Manufacturing (
Cigarettes
 Click to Enlarge