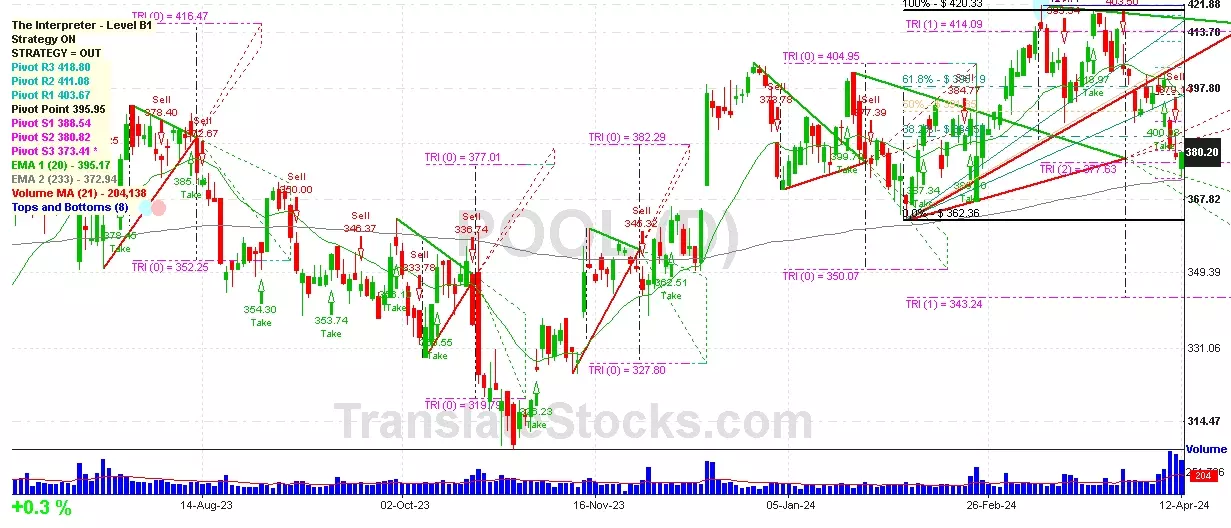
Hey Friend, I'm analysing POOL CORP (POOL), and it is between the Support of $ 377.63 (Triangle Projection Level 2) and the Resistance of $ 380.82 (PivotS2). The stock is also approaching the line of PivotS2 at $ 380.82, and if it goes above this line it could reach the next Resistance of Triangle projection at $382.29.

| Date | Price $ | Result % | Candle Name | Side |
|---|---|---|---|---|
| 001 12 Apr 2024 | Buy Price: 380.20 | Profit: Open Day1 ($ 382.77) | Engulfing | Buy |
| 002 21 Feb 2024 | Buy Price: 389.10 | Loss: Close Day2 ($ 387.61) | Abandoned Baby | Buy |
| 003 13 Feb 2024 | Sell Price: 375.88 | Loss: Close Day2 ($ 389.13) | Abandoned Baby | Sell |
| 004 18 Jan 2024 | Buy Price: 387.00 | Profit: Open Day1 ($ 387.01) | Abandoned Baby | Buy |
| 005 24 Nov 2023 | Sell Price: 354.75 | Profit: Open Day1 ($ 353.10) | Abandoned Baby | Sell |
| 006 21 Nov 2023 | Buy Price: 352.40 | Profit: Open Day1 ($ 354.87) | Engulfing | Buy |
| 007 14 Nov 2023 | Buy Price: 349.31 | Profit: Open Day1 ($ 351.31) | Abandoned Baby | Buy |
| 008 02 Oct 2023 | Sell Price: 349.00 | Profit: Open Day1 ($ 346.05) | Abandoned Baby | Sell |
| 009 19 Sep 2023 | Buy Price: 347.59 | Profit: Open Day1 ($ 349.14) | Piercing Line | Buy |
| 010 15 Sep 2023 | Sell Price: 349.90 | Profit: Open Day1 ($ 348.96) | Engulfing | Sell |
| 011 15 Sep 2023 | Sell Price: 350.10 | Profit: Open Day1 ($ 348.96) | Dark Cloud Cover | Sell |
| 012 31 Aug 2023 | Sell Price: 365.60 | Profit: Close Day2 ($ 358.15) | Engulfing | Sell |
| 013 11 Aug 2023 | Sell Price: 375.00 | Profit: Open Day1 ($ 371.74) | Abandoned Baby | Sell |
| 014 03 Jul 2023 | Sell Price: 371.48 | Profit: Open Day1 ($ 370.37) | Abandoned Baby | Sell |
| 015 20 Jun 2023 | Sell Price: 353.51 | Profit: Close Day2 ($ 350.28) | Abandoned Baby | Sell |
| 016One Year Average | Both Sides Result for 15 Signals |
Profit: $ 15.59 ($ 1.04 / Signal) |
All of Them | Buy + Sell |
| Simple Moving Averages (SMA) Period | Value $ | Signal | Exponential Moving Averages (EMA) Period | Value $ | Signal | |
|---|---|---|---|---|---|---|
| 2 | 376.19 | BUY | 2 | 375.44 | BUY | |
| 3 | 372.75 | BUY | 3 | 373.62 | BUY | |
| 5 | 368.46 | BUY | 5 | 372.03 | BUY | |
| 8 | 368.75 | BUY | 8 | 372.74 | BUY | |
| 13 | 375.97 | BUY | 13 | 376.28 | BUY | |
| 21 | 384.99 | SELL | 21 | 381.39 | SELL | |
| 34 | 393.44 | SELL | 34 | 385.67 | SELL | |
| 55 | 392.06 | SELL | 55 | 386.78 | SELL | |
| 90 | 389.62 | SELL | 90 | 383.67 | SELL | |
| 200 | 369.36 | BUY | 200 | 373.61 | BUY |
Pool Corp
IPO: 1995-10-13
Ticker: POOLIndices: S&P 500,
Exchange: Nasdaq Nms - Global Market (US - USD)
Website: http://www.poolcorp.com/
Phone:
Common Stock
Trade & Services (
Wholesale-misc Durable Goods
 Click to Enlarge