
| Date | Price $ | Result % | Candle Name | Side |
|---|---|---|---|---|
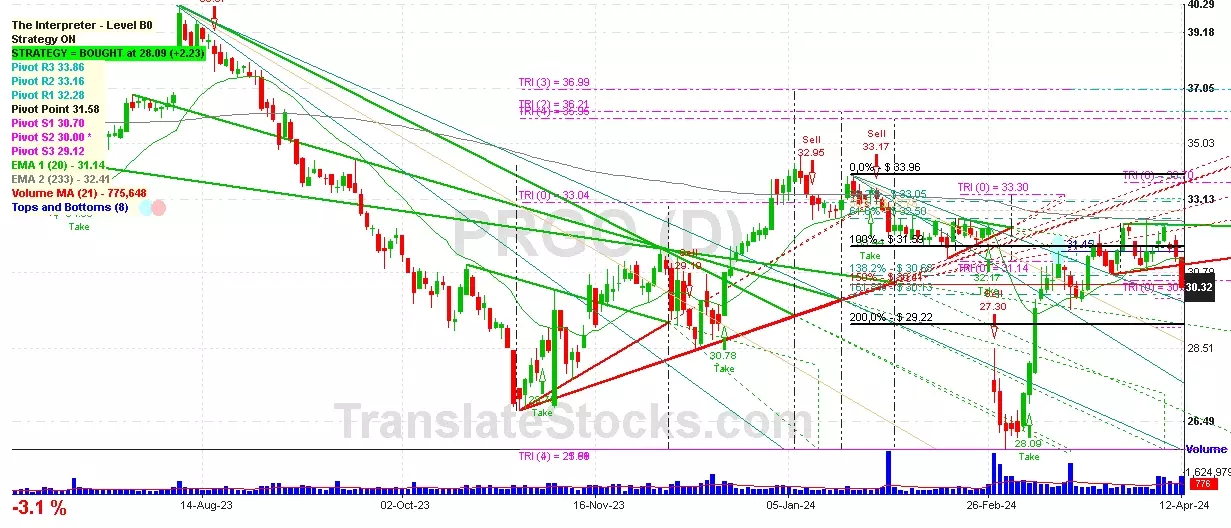
| 001 10 Apr 2024 | Sell Price: 31.54 | Profit: Close Day1 ($ 31.28) | Abandoned Baby | Sell |
| 002 04 Apr 2024 | Buy Price: 31.45 | Profit: Open Day2 ($ 31.70) | Engulfing | Buy |
| 003 06 Feb 2024 | Buy Price: 32.15 | Loss: Close Day2 ($ 31.86) | Piercing Line | Buy |
| 004 29 Jan 2024 | Sell Price: 33.17 | Profit: Close Day1 ($ 32.75) | Engulfing | Sell |
| 005 18 Jan 2024 | Buy Price: 32.78 | Profit: Open Day1 ($ 32.81) | Abandoned Baby | Buy |
| 006 19 Sep 2023 | Sell Price: 33.54 | Profit: Close Day1 ($ 33.37) | Engulfing | Sell |
| 007 12 Jul 2023 | Sell Price: 33.08 | Loss: Close Day2 ($ 34.03) | Dark Cloud Cover | Sell |
| 008 13 Jun 2023 | Buy Price: 33.11 | Profit: Open Day1 ($ 33.12) | Piercing Line | Buy |
| 009 03 May 2023 | Sell Price: 37.49 | Profit: Open Day1 ($ 37.40) | Dark Cloud Cover | Sell |
| 010One Year Average | Both Sides Result for 9 Signals |
Loss: $ -0.01 ($ -0.00 / Signal) |
All of Them | Buy + Sell |
| Simple Moving Averages (SMA) Period | Value $ | Signal | Exponential Moving Averages (EMA) Period | Value $ | Signal | |
|---|---|---|---|---|---|---|
| 2 | 30.00 | BUY | 2 | 30.05 | SELL | |
| 3 | 30.04 | SELL | 3 | 30.14 | SELL | |
| 5 | 30.35 | SELL | 5 | 30.36 | SELL | |
| 8 | 30.91 | SELL | 8 | 30.61 | SELL | |
| 13 | 31.12 | SELL | 13 | 30.80 | SELL | |
| 21 | 31.16 | SELL | 21 | 30.86 | SELL | |
| 34 | 30.35 | SELL | 34 | 30.87 | SELL | |
| 55 | 30.83 | SELL | 55 | 30.94 | SELL | |
| 90 | 31.30 | SELL | 90 | 31.13 | SELL | |
| 200 | 32.14 | SELL | 200 | 32.04 | SELL |
Perrigo Co Plc
IPO: 1991-12-17
Ticker: PRGOIndices: S&P 500,
Exchange: New York Stock Exchange, Inc. (IE - USD)
Website: https://www.perrigo.com/
Phone:
Common Stock
Life Sciences (
Pharmaceutical Preparations

 Click to Enlarge