| Date | Price $ | Result % | Candle Name | Side |
|---|---|---|---|---|
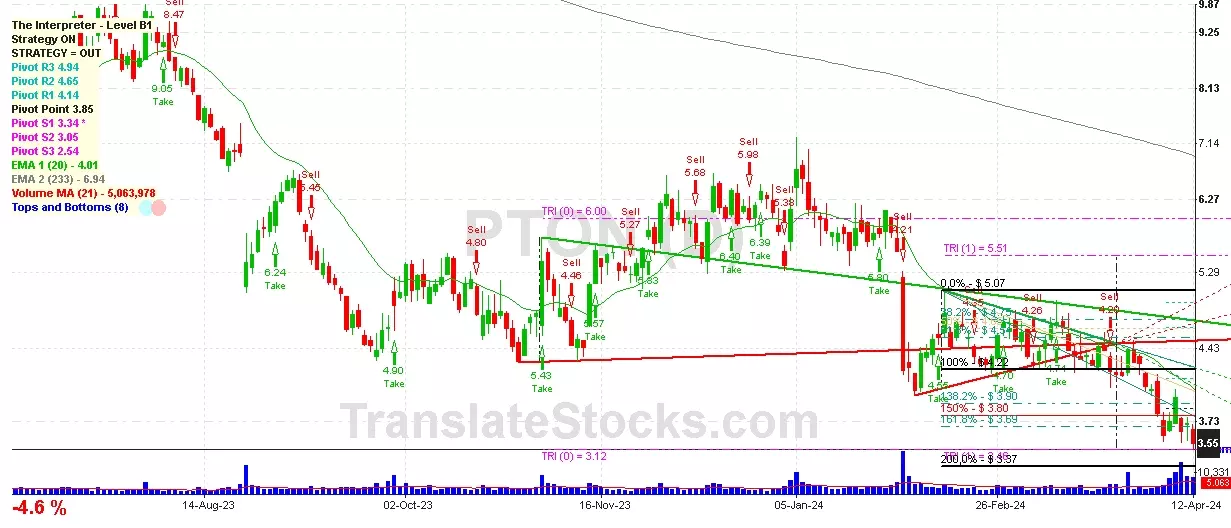
| 001 12 Mar 2024 | Sell Price: 4.64 | Profit: Open Day1 ($ 4.58) | Engulfing | Sell |
| 002 06 Mar 2024 | Buy Price: 4.40 | Profit: Open Day1 ($ 4.43) | Abandoned Baby | Buy |
| 003 28 Feb 2024 | Sell Price: 4.64 | Profit: Close Day1 ($ 4.52) | Abandoned Baby | Sell |
| 004 23 Feb 2024 | Buy Price: 4.35 | Profit: Close Day1 ($ 4.57) | Engulfing | Buy |
| 005 04 Jan 2024 | Buy Price: 6.13 | Profit: Open Day1 ($ 6.45) | Abandoned Baby | Buy |
| 006 13 Dec 2023 | Buy Price: 5.94 | Profit: Open Day1 ($ 6.10) | Engulfing | Buy |
| 007 30 Nov 2023 | Sell Price: 5.66 | Loss: Close Day2 ($ 6.34) | Engulfing | Sell |
| 008 21 Nov 2023 | Sell Price: 5.31 | Profit: Open Day2 ($ 5.27) | Abandoned Baby | Sell |
| 009 26 Sep 2023 | Buy Price: 4.62 | Profit: Open Day1 ($ 4.64) | Abandoned Baby | Buy |
| 010 14 Jul 2023 | Sell Price: 8.69 | Profit: Open Day1 ($ 8.68) | Engulfing | Sell |
| 011 27 Jun 2023 | Buy Price: 7.50 | Loss: Close Day2 ($ 7.46) | Abandoned Baby | Buy |
| 012 15 Jun 2023 | Sell Price: 8.96 | Profit: Close Day1 ($ 8.64) | Abandoned Baby | Sell |
| 013 07 Jun 2023 | Sell Price: 8.10 | Loss: Close Day2 ($ 8.31) | Dark Cloud Cover | Sell |
| 014 22 May 2023 | Buy Price: 7.33 | Loss: Close Day2 ($ 7.06) | Engulfing | Buy |
| 015 09 May 2023 | Sell Price: 7.83 | Profit: Close Day1 ($ 7.53) | Abandoned Baby | Sell |
| 016 02 May 2023 | Sell Price: 8.61 | Profit: Open Day1 ($ 8.57) | Engulfing | Sell |
| 017One Year Average | Both Sides Result for 16 Signals |
Profit: $ 0.44 ($ 0.03 / Signal) |
All of Them | Buy + Sell |
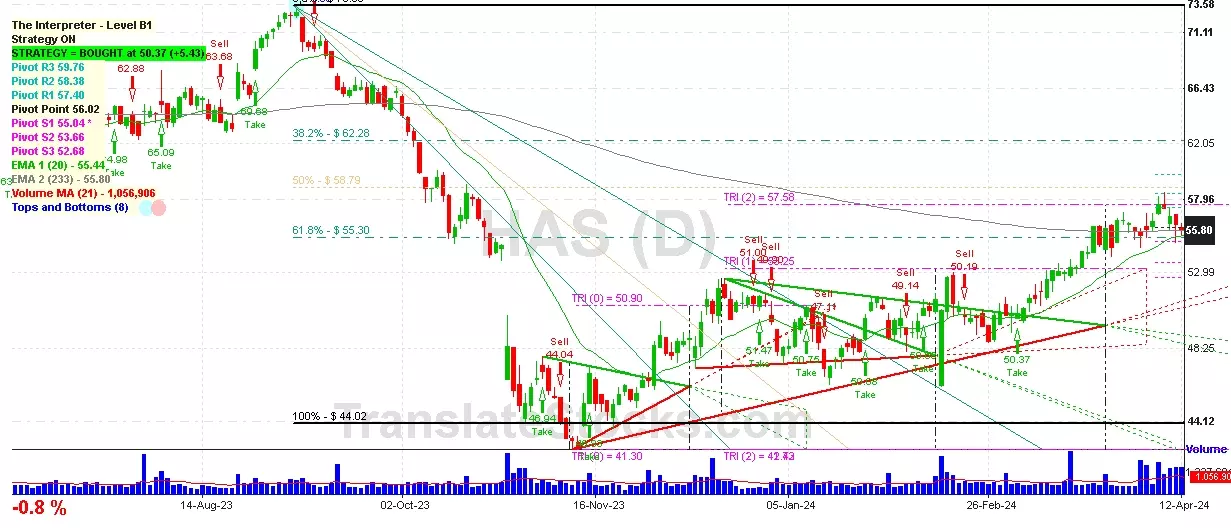
| Simple Moving Averages (SMA) Period | Value $ | Signal | Exponential Moving Averages (EMA) Period | Value $ | Signal | |
|---|---|---|---|---|---|---|
| 2 | 3.04 | BUY | 2 | 3.05 | BUY | |
| 3 | 3.05 | BUY | 3 | 3.06 | SELL | |
| 5 | 3.07 | SELL | 5 | 3.12 | SELL | |
| 8 | 3.24 | SELL | 8 | 3.23 | SELL | |
| 13 | 3.44 | SELL | 13 | 3.41 | SELL | |
| 21 | 3.73 | SELL | 21 | 3.62 | SELL | |
| 34 | 4.00 | SELL | 34 | 3.88 | SELL | |
| 55 | 4.18 | SELL | 55 | 4.19 | SELL | |
| 90 | 4.86 | SELL | 90 | 4.59 | SELL | |
| 200 | 5.61 | SELL | 200 | 5.95 | SELL |
Peloton Interactive Inc-a
IPO: 2019-09-26
Ticker: PTONIndices: Nasdaq 100,
Exchange: Nasdaq Nms - Global Market (US - USD)
Website: https://www.onepeloton.com/
Phone:
Common Stock
Manufacturing (
Sporting & Athletic Goods, Nec

 Click to Enlarge