
| Date | Price $ | Result % | Candle Name | Side |
|---|---|---|---|---|
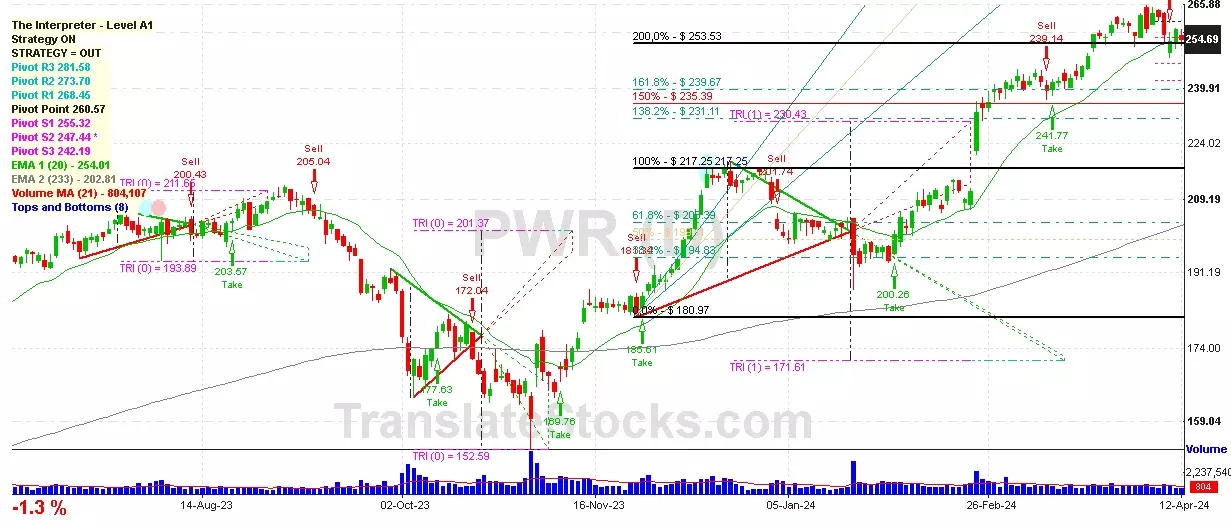
| 001 05 Mar 2024 | Sell Price: 239.71 | Loss: Close Day2 ($ 244.32) | Abandoned Baby | Sell |
| 002 28 Feb 2024 | Sell Price: 238.53 | Loss: Close Day2 ($ 240.89) | Abandoned Baby | Sell |
| 003 28 Feb 2024 | Sell Price: 238.63 | Loss: Close Day2 ($ 240.89) | Engulfing | Sell |
| 004 20 Jun 2023 | Sell Price: 185.75 | Profit: Open Day1 ($ 185.60) | Abandoned Baby | Sell |
| 005One Year Average | Both Sides Result for 4 Signals |
Loss: $ -9.08 ($ -2.27 / Signal) |
All of Them | Buy + Sell |
| Simple Moving Averages (SMA) Period | Value $ | Signal | Exponential Moving Averages (EMA) Period | Value $ | Signal | |
|---|---|---|---|---|---|---|
| 2 | 245.82 | SELL | 2 | 246.17 | SELL | |
| 3 | 246.78 | SELL | 3 | 246.97 | SELL | |
| 5 | 248.78 | SELL | 5 | 248.70 | SELL | |
| 8 | 251.58 | SELL | 8 | 250.69 | SELL | |
| 13 | 254.98 | SELL | 13 | 252.17 | SELL | |
| 21 | 255.71 | SELL | 21 | 251.54 | SELL | |
| 34 | 250.59 | SELL | 34 | 247.39 | SELL | |
| 55 | 237.34 | BUY | 55 | 239.51 | BUY | |
| 90 | 225.01 | BUY | 90 | 228.86 | BUY | |
| 200 | 205.74 | BUY | 200 | 208.74 | BUY |
Quanta Services Inc
IPO: 1998-02-12
Ticker: PWRIndices: S&P 500,
Exchange: New York Stock Exchange, Inc. (US - USD)
Website: http://www.quantaservices.com
Phone:
Common Stock
Real Estate & Construction (
Electrical Work
Year | 2020 | 2019 | 2018 | 2017 | 2016 | 2015 | 2014 | 2013 | 2012 | 2011 | 2010 | 2009 | 2008 | 2007 | 2006 | |
|---|---|---|---|---|---|---|---|---|---|---|---|---|---|---|---|---|
| 1 | Assets + | 8,398 | 8,332 | 7,076 | 6,480 | 5,354 | 5,214 | 6,312 | 5,793 | 5,141 | 4,699 | 4,341 | 4,117 | 3,558 | 407 | 384 |
| 2 | Real Estate Investment Property + | 0 | 0 | 61 | 49 | 46 | 41 | 41 | 31 | 16 | 16 | 16 | 0 | 0 | 0 | 0 |
| 3 | Real Estate Investment Property + | 0 | 0 | 61 | 49 | 46 | 41 | 41 | 31 | 16 | 16 | 16 | 0 | 0 | 0 | 0 |
| 4 | Cash and Cash Equivalents + | 185 | 165 | 79 | 138 | 112 | 129 | 191 | 489 | 395 | 315 | 539 | 700 | 438 | 407 | 384 |
| 5 | Property + | -1,372 | -1,250 | 1,276 | 1,289 | 1,174 | 1,102 | 1,480 | 1,206 | 1,046 | 972 | 901 | 854 | 635 | 0 | 0 |
| 6 | Property + | 0 | 0 | 2,368 | 2,270 | 2,037 | 1,857 | 2,220 | 1,838 | 1,601 | 1,492 | 1,329 | 0 | 0 | 0 | 0 |
| 7 | Intangible Assets + | 436 | 414 | 280 | 263 | 187 | 205 | 261 | 208 | 184 | 207 | 194 | 185 | 141 | 0 | 0 |
| 8 | Finite-Lived Intangible Assets + | 433 | 411 | 277 | 263 | 187 | 205 | 256 | 203 | 179 | 203 | 194 | -96 | -57 | 0 | 0 |
| 9 | Liabilities and Equity + | 8,398 | 8,332 | 7,076 | 6,480 | 5,354 | 5,214 | 6,312 | 5,793 | 5,141 | 4,699 | 4,341 | 4,117 | 3,558 | 2,219 | 740 |
| 10 | Liabilities + | 4,049 | 4,278 | 3,470 | 2,685 | 2,011 | 2,126 | 1,786 | 1,552 | 1,369 | 1,310 | 974 | 1,006 | 876 | 0 | 0 |
| 11 | Debt and Lease Obligation + | 4 | 7 | 33 | 0 | 3 | 5 | 5 | 2 | 0 | 0 | 0 | 0 | 0 | 0 | 0 |
| 12 | Stockholders' Equity + | 4,349 | 4,054 | 3,605 | 3,796 | 3,343 | 3,088 | 4,526 | 4,241 | 3,772 | 3,389 | 3,367 | 3,111 | 2,682 | 2,219 | 740 |
| 13 | Stockholders' Equity Attributable to Parent + | 4,344 | 4,050 | 3,604 | 3,792 | 3,339 | 3,085 | 4,514 | 4,234 | 3,767 | 3,382 | 3,366 | 3,109 | 2,682 | 0 | 0 |
| 14 | Partners' Capital + | 3,265 | 2,854 | 2,477 | 2,191 | 1,876 | 1,678 | 1,367 | 1,070 | 668 | 362 | 229 | 76 | -86 | 0 | 0 |
| 15 | Partners' Capital + | 3,265 | 2,854 | 2,477 | 2,191 | 1,876 | 1,678 | 1,367 | 1,070 | 668 | 362 | 229 | 76 | -86 | 0 | 0 |
| 16 | Limited Liability Company (LLC) Members' Equity + | 3,032 | 2,612 | 2,191 | 1,988 | 1,604 | 1,383 | 1,244 | 1,033 | 682 | 363 | 243 | 80 | -89 | 0 | 0 |
| 17 | Limited Liability Company (LLC) Members' Equity + | 3,032 | 2,612 | 2,191 | 1,988 | 1,604 | 1,383 | 1,244 | 1,033 | 682 | 363 | 243 | 80 | -89 | 0 | 0 |
| 18 | Current Assets + | 3,588 | 3,831 | 3,326 | 2,870 | 2,289 | 2,278 | 2,554 | 2,313 | 2,202 | 1,765 | 1,596 | 1,583 | 1,385 | 0 | 0 |
| 19 | Current Other Undisclosed Receivables | 0 | 0 | 0 | 0 | 700 | 582 | 0 | 0 | 0 | 0 | 0 | 0 | 0 | 0 | 0 |
| 20 | Current Receivables + | 2,716 | 2,748 | 2,355 | 1,985 | 2,200 | 2,203 | 1,813 | 1,439 | 1,328 | 1,066 | 766 | 688 | 795 | 0 | 0 |
| 21 | Inventory + | 50 | 56 | 108 | 81 | 89 | 75 | 39 | 32 | 38 | 71 | 52 | 33 | 26 | 0 | 0 |
| 22 | Current Contract with Customer + | 454 | 601 | 577 | 497 | 0 | 0 | 0 | 0 | 0 | 0 | 0 | 0 | 0 | 0 | 0 |
| 23 | Current Disposal Group + | 0 | 0 | 14 | 0 | 0 | 0 | 14 | 0 | 0 | 133 | 0 | 0 | 0 | 0 | 0 |
| 24 | Long-Term Assets + | 2,834 | 2,714 | 2,211 | 2,085 | 1,714 | 1,629 | 2,017 | 2,067 | 1,710 | 1,755 | 1,650 | 1,495 | 1,396 | 0 | 0 |
| 25 | Long-term Investments and Receivables + | 56 | 45 | 26 | 0 | 0 | 0 | 0 | 0 | 0 | 0 | 0 | 0 | 0 | 0 | 0 |
| 26 | Long-Term Disposal Group + | 0 | 0 | 0 | 0 | 0 | 0 | 1,479 | 0 | 0 | 0 | 0 | 0 | 0 | 0 | 0 |
| 27 | Current Liabilities + | 2,139 | 2,263 | 1,806 | 1,492 | 1,205 | 1,204 | 1,137 | 1,044 | 881 | 781 | 500 | 496 | 452 | 0 | 0 |
| 28 | Long-Term Other Undisclosed Liabilities | 0 | 0 | 0 | -29 | 0 | 0 | 0 | 0 | 225 | 231 | 212 | 166 | 84 | 0 | 0 |
| 29 | Long-Term Liabilities + | 1,968 | 2,062 | 1,698 | 1,193 | 826 | 747 | 456 | 265 | 488 | 529 | 474 | 510 | 424 | 0 | 0 |
| 30 | Increase (Decrease) in Stockholders' Equity [Roll Forward] + | -858 | -587 | -554 | -85 | -14 | -1,795 | -322 | -215 | -203 | -196 | -40 | -36 | -32 | 0 | 0 |
| 31 | Treasury Stock Transactions + | -858 | -587 | -554 | -85 | -14 | -1,795 | -322 | -215 | -203 | -196 | -40 | -36 | -32 | 0 | 0 |
| 32 | Treasury Stock + | -858 | -587 | -554 | -85 | -14 | -1,795 | -322 | -215 | -203 | -196 | -40 | -36 | -32 | 0 | 0 |
| 33 | Current Other Assets + | 0 | 0 | 0 | 0 | 0 | 0 | 222 | 140 | 98 | 106 | 104 | 100 | 72 | 0 | 0 |
| 34 | Total Current Assets + | 3,588 | 3,831 | 3,326 | 2,870 | 2,289 | 2,278 | 2,554 | 2,313 | 2,202 | 1,765 | 1,596 | 1,583 | 1,385 | 0 | 0 |
| 35 | Operating Lease + | 257 | 284 | 0 | 0 | 0 | 0 | 0 | 0 | 0 | 0 | 0 | 0 | 0 | 0 | 0 |
| 36 | Finance Lease + | 259 | 285 | 0 | 0 | 0 | 0 | 0 | 0 | 0 | 0 | 0 | 0 | 0 | 0 | 0 |
| 37 | Goodwill + | 2,121 | 2,023 | 1,900 | 1,869 | 1,603 | 1,553 | 1,931 | 1,781 | 1,538 | 1,601 | 1,561 | 1,450 | 1,363 | 0 | 0 |
| 38 | Long-Term Other Assets + | 436 | 393 | 294 | 190 | 101 | 76 | 86 | 286 | 172 | 154 | 89 | 45 | 33 | 0 | 0 |
| 39 | Deferred Income Tax Assets + | 454 | 406 | 311 | 216 | 111 | 0 | 0 | 0 | 0 | 0 | 0 | 0 | 0 | 0 | 0 |
| 40 | Total Assets + | 8,398 | 8,332 | 7,076 | 6,480 | 5,354 | 5,214 | 6,312 | 5,793 | 5,141 | 4,699 | 4,341 | 4,117 | 3,558 | 0 | 0 |
| 41 | Total Liabilities + | 4,049 | 4,278 | 3,470 | 2,685 | 2,011 | 2,126 | 1,786 | 1,552 | 1,369 | 1,310 | 974 | 1,006 | 876 | 0 | 0 |
| 42 | Stockholders' Equity Attributable to Noncontrolling Interest + | 5 | 4 | 1 | 4 | 3 | 2 | 11 | 7 | 5 | 7 | 1 | 1 | 0 | 0 | 0 |
| 43 | Total Stockholders' Equity + | 4,349 | 4,054 | 3,605 | 3,796 | 3,343 | 3,088 | 4,526 | 4,241 | 3,772 | 3,389 | 3,367 | 3,111 | 2,682 | 2,219 | 740 |
| 44 | Total Liabilities and Equity + | 8,398 | 8,332 | 7,076 | 6,480 | 5,354 | 5,214 | 6,312 | 5,793 | 5,141 | 4,699 | 4,341 | 4,117 | 3,558 | 0 | 0 |
Year | 2020 | 2019 | 2018 | 2017 | 2016 | 2015 | 2014 | 2013 | 2012 | 2011 | 2010 | 2009 | 2008 | 2007 | |
|---|---|---|---|---|---|---|---|---|---|---|---|---|---|---|---|
| 1 | -9,542 | -10,512 | -9,691 | -8,225 | -6,638 | 0 | 0 | 0 | 0 | 0 | 0 | 0 | 0 | 0 | |
| 2 | 1,661 | 1,600 | 1,480 | 1,242 | 1,014 | 924 | 1,234 | 1,055 | 938 | 621 | 634 | 593 | 635 | 429 | |
| 3 | 0 | 0 | 0 | 0 | 0 | 0 | 1 | 0 | 0 | 0 | 0 | 0 | 0 | 0 | |
| 4 | 975 | 956 | 858 | 778 | 653 | 593 | 722 | 501 | 435 | 373 | 340 | 312 | 309 | 241 | |
| 5 | 4 | 11 | 7 | 0 | -1 | 0 | 1 | 3 | 4 | 1 | 0 | 3 | 7 | 1 | |
| 6 | 3 | 6 | -3 | 1 | 1 | 3 | 2 | 2 | 1 | -1 | -5 | 9 | 2 | 5 | |
| 7 | 0 | 0 | 0 | 0 | 0 | 0 | 0 | 113 | 0 | 0 | 0 | 0 | 0 | 0 | |
| 8 | 611 | 555 | 540 | 379 | 321 | 238 | 476 | 527 | 465 | 218 | 256 | 242 | 289 | 169 | |
| 9 | 2 | 1 | 2 | 1 | 2 | 1 | 4 | 3 | 1 | 1 | 1 | 2 | 10 | 20 | |
| 10 | 0 | 0 | 0 | 0 | 0 | 0 | 0 | 0 | 0 | 0 | 0 | -1 | 0 | 0 | |
| 11 | 3 | 83 | -47 | -5 | -1 | -2 | -1 | -1 | 0 | -1 | 1 | 0 | 0 | -1 | |
| 12 | 0 | 0 | 0 | 0 | 0 | 0 | 0 | 0 | 0 | 0 | 0 | 0 | 0 | 0 | |
| 13 | 45 | 67 | 37 | 21 | 15 | 8 | 5 | 3 | 4 | 2 | 5 | 11 | 32 | 39 | |
| 14 | 0 | 0 | 0 | 0 | 0 | 0 | 0 | 0 | 0 | 0 | 0 | 0 | 0 | 0 | |
| 15 | 0 | 0 | 0 | 0 | 0 | 0 | 0 | 0 | 0 | 0 | 7 | 0 | 0 | 0 | |
| 16 | 0 | 0 | 0 | 0 | 0 | 0 | 0 | 0 | 0 | 216 | 246 | 234 | 267 | 150 | |
| 17 | 1 | 77 | -53 | -11 | -1 | 0 | 0 | 113 | 2 | 0 | 0 | 0 | 0 | 0 | |
| 18 | 571 | 572 | 458 | 354 | 308 | 229 | 473 | 639 | 465 | 194 | 234 | 0 | 0 | 0 | |
| 19 | -119 | -165 | -162 | -36 | -107 | -97 | -157 | -218 | -159 | -72 | -91 | -70 | -110 | -28 | |
| 20 | 0 | 0 | 134 | 282 | 93 | 34 | 159 | 203 | 147 | 58 | 54 | 94 | 48 | 94 | |
| 21 | 0 | 0 | 0 | 0 | 0 | 0 | -1 | 0 | 47 | 23 | 12 | 0 | 0 | 0 | |
| 22 | 0 | 0 | 0 | 0 | 0 | 0 | 0 | 0 | 18 | 0 | 0 | 0 | 0 | 0 | |
| 23 | 0 | 0 | 0 | 0 | 0 | 0 | 0 | 0 | 0 | 0 | 0 | 0 | 0 | -2 | |
| 24 | 0 | 0 | 0 | 0 | 0 | 0 | 0 | 0 | -48 | -9 | -2 | 0 | 0 | -1 | |
| 25 | 0 | 0 | 0 | 0 | 0 | 191 | -1 | 30 | 17 | 14 | 10 | 0 | 0 | 3 | |
| 26 | 452 | 407 | 296 | 318 | 200 | 322 | 315 | 421 | 323 | 144 | 156 | 164 | 158 | 125 | |
| 27 | 0 | 0 | 0 | 0 | 2 | 11 | 18 | 19 | 0 | 0 | 0 | 0 | 0 | 0 | |
| 28 | -6 | -5 | -3 | -3 | -2 | -11 | -18 | -19 | -16 | -12 | -2 | -1 | 0 | 0 | |
| 29 | Total Net Income (Loss) Attributable to Parent + | 446 | 402 | 293 | 315 | 0 | 0 | 0 | 0 | 0 | 0 | 0 | 0 | 0 | 0 |
| 30 | 446 | 402 | 293 | 315 | 198 | 311 | 297 | 402 | 307 | 133 | 153 | 162 | 158 | 125 | |
| 31 | Income (Loss) from Continuing Operations + | 0 | 0 | 296 | 318 | 200 | 131 | 316 | 421 | 306 | 130 | 145 | 164 | 158 | 122 |
| 32 | Total Income (Loss) from Continuing Operations + | 0 | 118 | 589 | 633 | 399 | 251 | 613 | 823 | 596 | 249 | 288 | 0 | 0 | 0 |
| 33 | Income (Loss) from Discontinued Operations + | 0 | 0 | 0 | 0 | 0 | 191 | -1 | 30 | 17 | 14 | 10 | 0 | 0 | 3 |
| 34 | Total Income (Loss) from Discontinued Operations + | 0 | 0 | 0 | 0 | 0 | 191 | -1 | 30 | 17 | 14 | 10 | 0 | 0 | 0 |
| 35 | Income (Loss) from Continuing Operations + | 0 | 0.81 | 1.92 | 2.02 | 1.26 | 0.62 | 0 | 0 | 1.36 | 0.56 | 0.68 | 0.81 | 0.89 | 0.89 |
| 36 | 0 | 0 | 0 | 0 | 0 | 0.97 | 0 | 0 | 0.08 | 0.06 | 0.05 | 0 | 0 | 0.02 | |
| 37 | Total Earnings Per Share + | 3.15 | 2.76 | 1.92 | 2.02 | 1.26 | 1.59 | 0 | 0 | 1.44 | 0.62 | 0.73 | 0.81 | 0.89 | 0.91 |
| 38 | Income (Loss) from Continuing Operations + | 0 | 0.81 | 1.92 | 2.02 | 1.26 | 0.62 | 0 | 0 | 1.36 | 0.56 | 0.68 | 0.81 | 0.89 | 0.89 |
| 39 | Income (Loss) from Continuing Operations + | 0 | 0.80 | 1.90 | 2 | 1.26 | 0.62 | 0 | 0 | 1.36 | 0.56 | 0.67 | 0.81 | 0.87 | 0.86 |
| 40 | 0 | 0 | 0 | 0 | 0 | 0.97 | 0 | 0 | 0.08 | 0.06 | 0.05 | 0 | 0 | 0.02 | |
| 41 | Total Earnings Per Share + | 3.07 | 2.73 | 1.90 | 2 | 1.26 | 1.59 | 0 | 0 | 1.44 | 0.62 | 0.72 | 0.81 | 0.87 | 0.88 |
| 42 | Income (Loss) from Continuing Operations + | 0 | 0 | 0 | 0 | 1.26 | 0.62 | 1.35 | 1.87 | 1.36 | 0.56 | 0 | 0 | 0 | 0 |
| 43 | 0 | 0 | 0 | 0 | 0 | 0.97 | 0.13 | 0.14 | 0.08 | 0.06 | 0 | 0 | 0 | 0 | |
| 44 | Total Earnings Per Share + | 0 | 0 | 0 | 0 | 1.26 | 1.59 | 1.35 | 1.87 | 1.44 | 0.62 | 0 | 0 | 0 | 0 |
| 45 | 0.06 | 0.05 | 0.04 | 0 | 0 | 0 | 0 | 0 | 0 | 0 | 0 | 0 | 0 | 0 |

 Click to Enlarge