| Date | Price $ | Result % | Candle Name | Side |
|---|---|---|---|---|
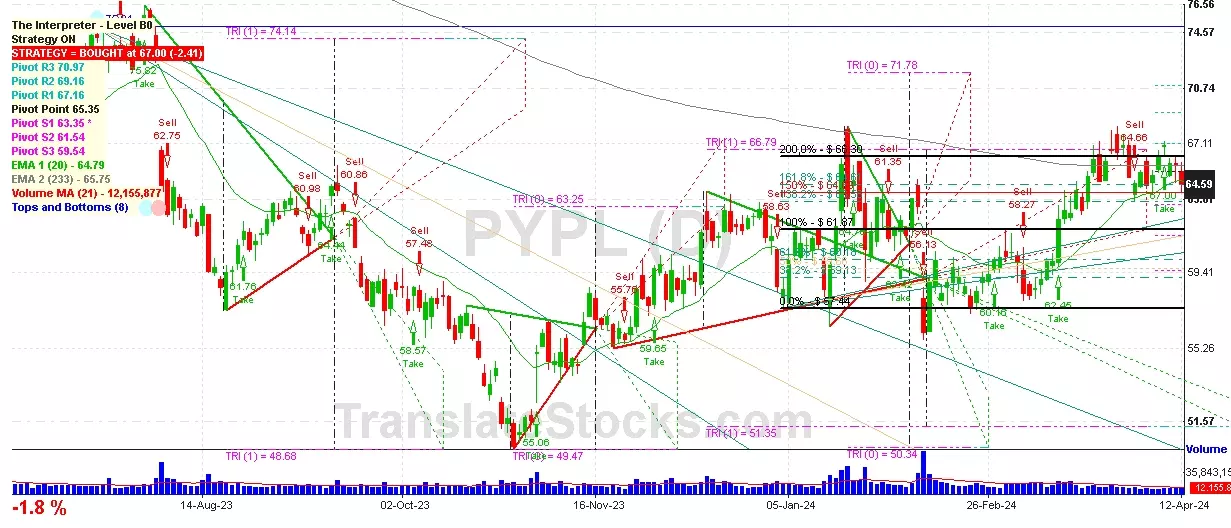
| 001 04 Apr 2024 | Sell Price: 64.53 | Loss: Close Day2 ($ 66.34) | Engulfing | Sell |
| 002 04 Apr 2024 | Sell Price: 64.54 | Loss: Close Day2 ($ 66.34) | Dark Cloud Cover | Sell |
| 003 06 Dec 2023 | Buy Price: 59.53 | Loss: Close Day2 ($ 58.94) | Engulfing | Buy |
| 004 04 Oct 2023 | Buy Price: 58.57 | Loss: Close Day2 ($ 57.77) | Abandoned Baby | Buy |
| 005One Year Average | Both Sides Result for 4 Signals |
Loss: $ -5.01 ($ -1.25 / Signal) |
All of Them | Buy + Sell |
| Simple Moving Averages (SMA) Period | Value $ | Signal | Exponential Moving Averages (EMA) Period | Value $ | Signal | |
|---|---|---|---|---|---|---|
| 2 | 62.21 | BUY | 2 | 62.38 | SELL | |
| 3 | 62.56 | SELL | 3 | 62.58 | SELL | |
| 5 | 62.92 | SELL | 5 | 63.01 | SELL | |
| 8 | 63.86 | SELL | 8 | 63.53 | SELL | |
| 13 | 64.56 | SELL | 13 | 63.97 | SELL | |
| 21 | 65.05 | SELL | 21 | 64.01 | SELL | |
| 34 | 63.55 | SELL | 34 | 63.59 | SELL | |
| 55 | 62.16 | BUY | 55 | 62.88 | SELL | |
| 90 | 61.95 | BUY | 90 | 62.18 | BUY | |
| 200 | 61.43 | BUY | 200 | 63.72 | SELL |
Paypal Holdings Inc
IPO: 2015-07-06
Ticker: PYPLIndices: S&P 500,
Nasdaq 100,
Exchange: Nasdaq Nms - Global Market (US - USD)
Website: https://www.paypal.com/
Phone:
Common Stock
Trade & Services (
Services-business Services, Nec

 Click to Enlarge