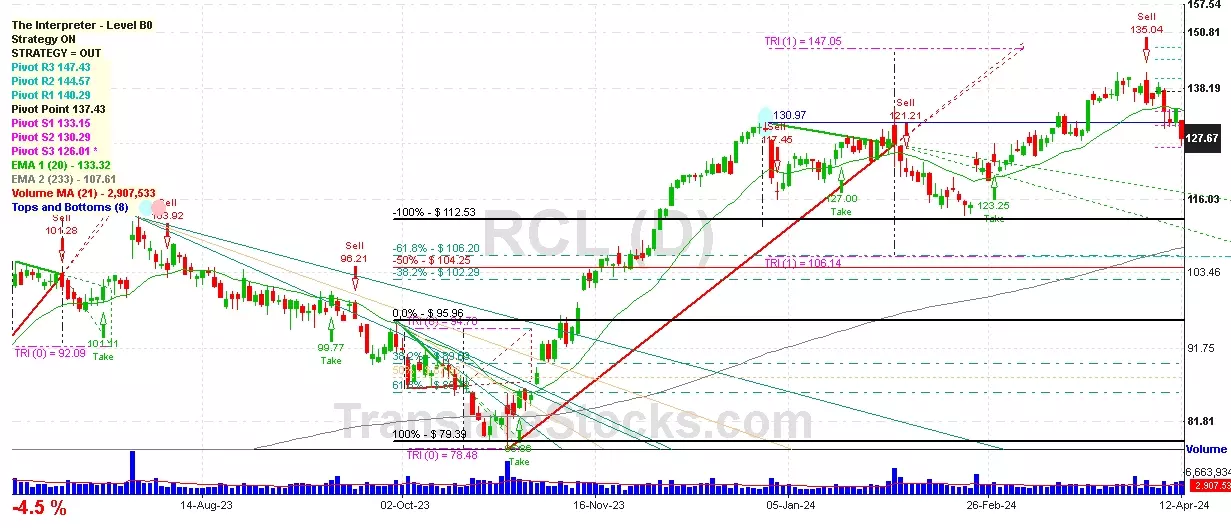
Hey Friend, I'm analysing ROYAL CARIBBEAN CRUISES LTD (RCL), and it is between the Support of $ 126.01 (PivotS3) and the Resistance of $ 130.29 (PivotS2). The stock is also approaching the line of PivotS3 at $ 126.01, and if it goes below this line it could reach the next Support of -100% of Fibonacci at $ 112.53.

| Date | Price $ | Result % | Candle Name | Side |
|---|---|---|---|---|
| 001 03 Apr 2024 | Buy Price: 138.49 | Profit: Open Day1 ($ 139.95) | Engulfing | Buy |
| 002 14 Mar 2024 | Sell Price: 128.71 | Profit: Close Day2 ($ 128.26) | Engulfing | Sell |
| 003 14 Mar 2024 | Sell Price: 128.87 | Profit: Open Day1 ($ 128.75) | Dark Cloud Cover | Sell |
| 004 16 Jan 2024 | Buy Price: 122.80 | Profit: Open Day2 ($ 123.79) | Piercing Line | Buy |
| 005 09 Jan 2024 | Sell Price: 123.57 | Profit: Open Day1 ($ 122.75) | Abandoned Baby | Sell |
| 006 12 Dec 2023 | Sell Price: 120.30 | Loss: Close Day2 ($ 121.39) | Dark Cloud Cover | Sell |
| 007 09 Nov 2023 | Sell Price: 92.60 | Loss: Close Day2 ($ 97.81) | Engulfing | Sell |
| 008 28 Jul 2023 | Sell Price: 108.57 | Profit: Open Day2 ($ 107.06) | Engulfing | Sell |
| 009 28 Jul 2023 | Sell Price: 108.45 | Profit: Open Day2 ($ 107.06) | Dark Cloud Cover | Sell |
| 010One Year Average | Both Sides Result for 9 Signals |
Profit: $ 0.44 ($ 0.05 / Signal) |
All of Them | Buy + Sell |
| Simple Moving Averages (SMA) Period | Value $ | Signal | Exponential Moving Averages (EMA) Period | Value $ | Signal | |
|---|---|---|---|---|---|---|
| 2 | 127.81 | SELL | 2 | 127.65 | SELL | |
| 3 | 127.40 | BUY | 3 | 127.74 | SELL | |
| 5 | 127.41 | BUY | 5 | 128.36 | SELL | |
| 8 | 129.36 | SELL | 8 | 129.53 | SELL | |
| 13 | 132.32 | SELL | 13 | 130.85 | SELL | |
| 21 | 134.28 | SELL | 21 | 131.35 | SELL | |
| 34 | 131.75 | SELL | 34 | 130.54 | SELL | |
| 55 | 127.33 | BUY | 55 | 128.25 | SELL | |
| 90 | 126.04 | BUY | 90 | 123.89 | BUY | |
| 200 | 110.54 | BUY | 200 | 111.32 | BUY |
Royal Caribbean Cruises Ltd
IPO: 1993-04-28
Ticker: RCLIndices: S&P 500,
Exchange: New York Stock Exchange, Inc. (US - USD)
Website: https://www.royalcaribbeangroup.com/
Phone:
Common Stock
Energy & Transportation (
Water Transportation
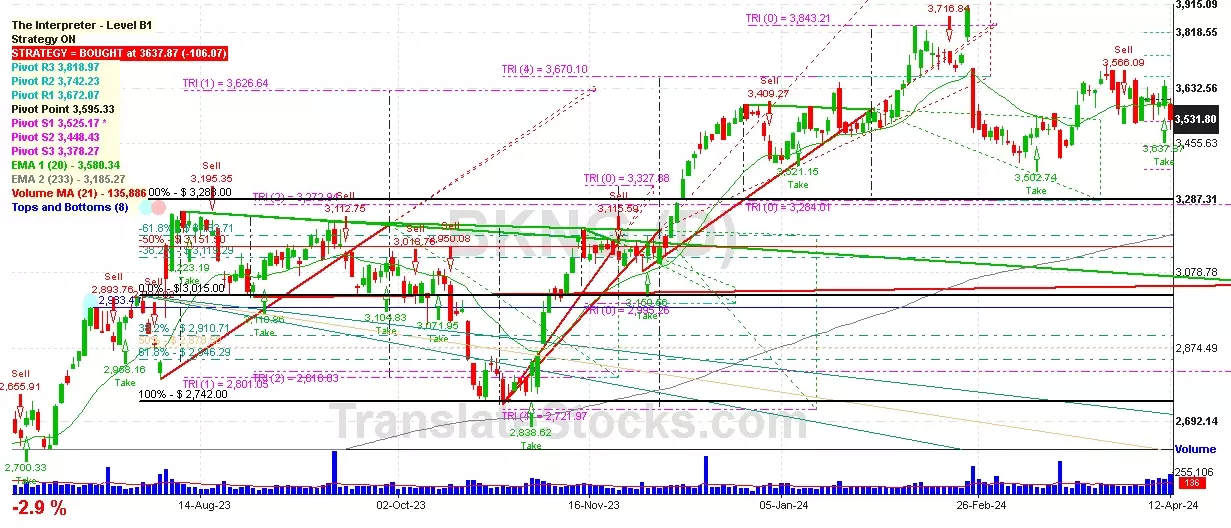
 Click to Enlarge
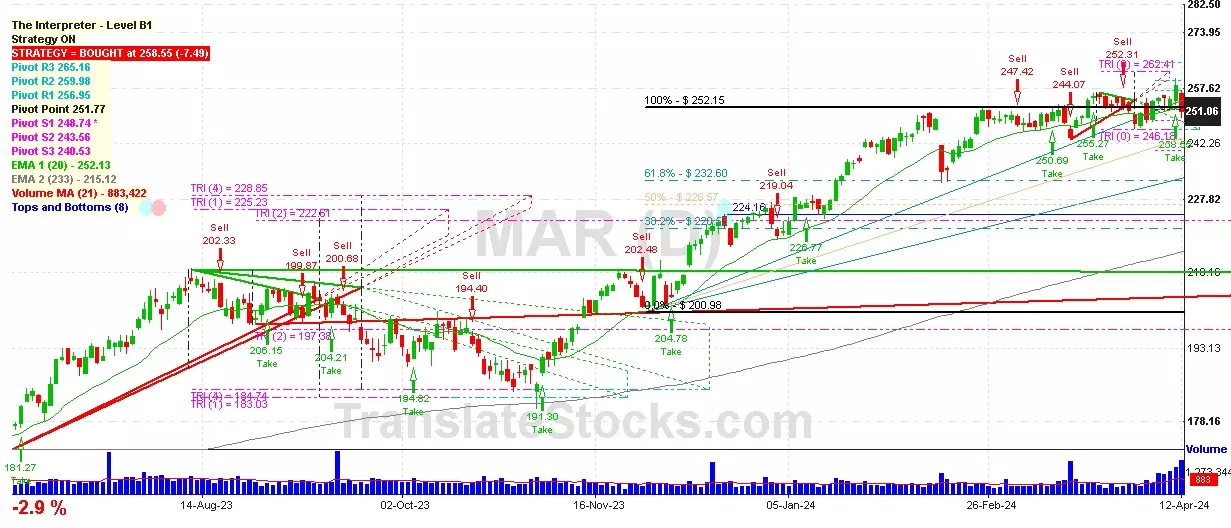