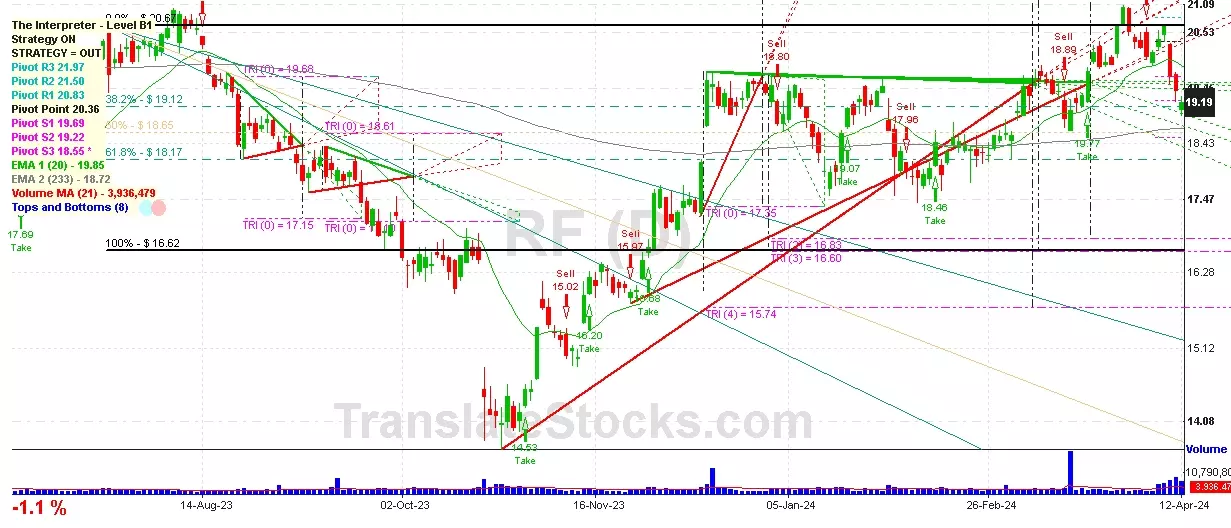
Hey Friend, I'm analysing REGIONS FINANCIAL CORP (RF), and it is between the Support of $ 18.90 (61.8% of Fibonacci) and the Resistance of $ 19.22 (PivotS2). The stock is also approaching the line of PivotS2 at $ 19.22, and if it goes above this line it could reach the next Resistance of 50% of Fibonacci at $ 19.31.

| Date | Price $ | Result % | Candle Name | Side |
|---|---|---|---|---|
| 001 01 Apr 2024 | Sell Price: 20.56 | Profit: Open Day1 ($ 20.44) | Engulfing | Sell |
| 002 15 Mar 2024 | Buy Price: 19.05 | Profit: Open Day1 ($ 19.26) | Piercing Line | Buy |
| 003 01 Mar 2024 | Sell Price: 18.59 | Loss: Close Day2 ($ 19.49) | Abandoned Baby | Sell |
| 004 25 Jan 2024 | Sell Price: 19.13 | Profit: Open Day2 ($ 19.12) | Engulfing | Sell |
| 005 25 Jan 2024 | Sell Price: 19.15 | Profit: Open Day2 ($ 19.12) | Dark Cloud Cover | Sell |
| 006 18 Jan 2024 | Buy Price: 17.95 | Profit: Close Day1 ($ 18.62) | Abandoned Baby | Buy |
| 007 14 Nov 2023 | Buy Price: 15.92 | Profit: Open Day1 ($ 15.95) | Abandoned Baby | Buy |
| 008 26 Oct 2023 | Buy Price: 14.43 | Loss: Close Day2 ($ 14.22) | Abandoned Baby | Buy |
| 009 20 Sep 2023 | Sell Price: 17.81 | Profit: Open Day1 ($ 17.75) | Engulfing | Sell |
| 010 20 Sep 2023 | Sell Price: 17.84 | Profit: Open Day1 ($ 17.75) | Dark Cloud Cover | Sell |
| 011 05 Sep 2023 | Sell Price: 18.42 | Profit: Open Day1 ($ 18.25) | Engulfing | Sell |
| 012 13 Jun 2023 | Buy Price: 18.45 | Profit: Open Day1 ($ 18.60) | Engulfing | Buy |
| 013 31 May 2023 | Sell Price: 17.27 | Loss: Close Day2 ($ 18.06) | Abandoned Baby | Sell |
| 014 26 May 2023 | Buy Price: 17.78 | Profit: Open Day1 ($ 17.98) | Abandoned Baby | Buy |
| 015One Year Average | Both Sides Result for 14 Signals |
Loss: $ -0.17 ($ -0.01 / Signal) |
All of Them | Buy + Sell |
| Simple Moving Averages (SMA) Period | Value $ | Signal | Exponential Moving Averages (EMA) Period | Value $ | Signal | |
|---|---|---|---|---|---|---|
| 2 | 18.93 | BUY | 2 | 18.96 | BUY | |
| 3 | 18.89 | BUY | 3 | 18.98 | BUY | |
| 5 | 19.02 | SELL | 5 | 19.10 | SELL | |
| 8 | 19.36 | SELL | 8 | 19.28 | SELL | |
| 13 | 19.70 | SELL | 13 | 19.48 | SELL | |
| 21 | 19.90 | SELL | 21 | 19.56 | SELL | |
| 34 | 19.66 | SELL | 34 | 19.49 | SELL | |
| 55 | 19.13 | SELL | 55 | 19.27 | SELL | |
| 90 | 19.04 | SELL | 90 | 18.93 | BUY | |
| 200 | 18.25 | BUY | 200 | 18.67 | BUY |
Regions Financial Corp
IPO: 2002-05-03
Ticker: RFIndices: S&P 500,
Exchange: New York Stock Exchange, Inc. (US - USD)
Website: https://www.regions.com/
Phone:
Common Stock
Finance (
National Commercial Banks
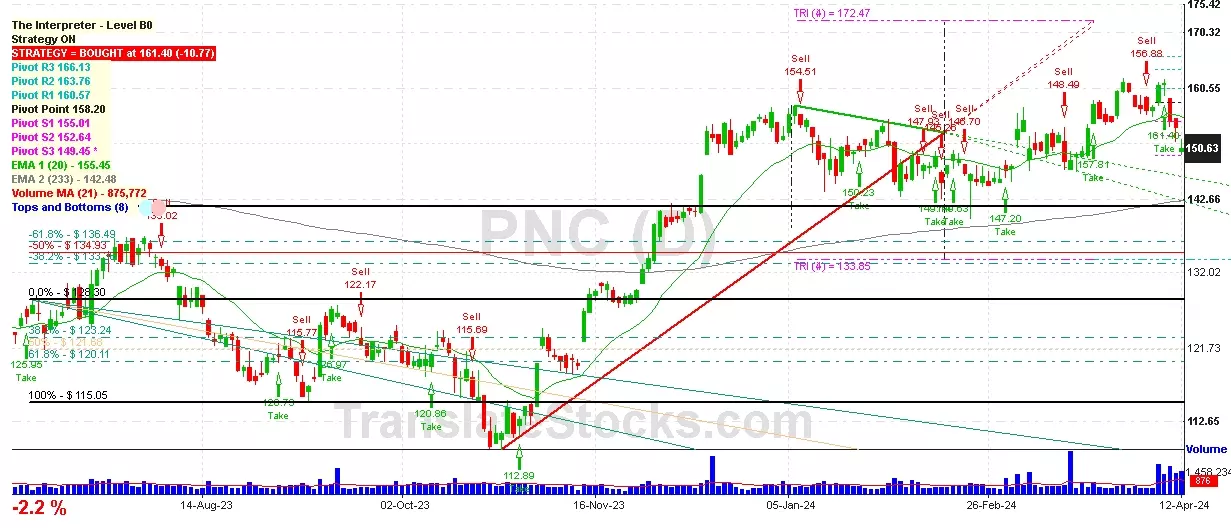
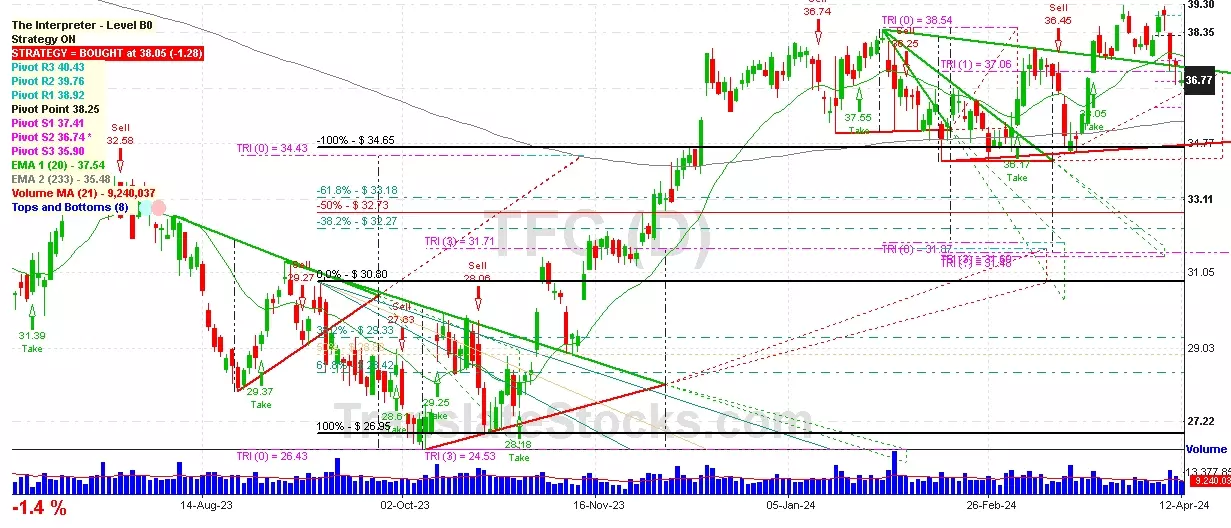
 Click to Enlarge
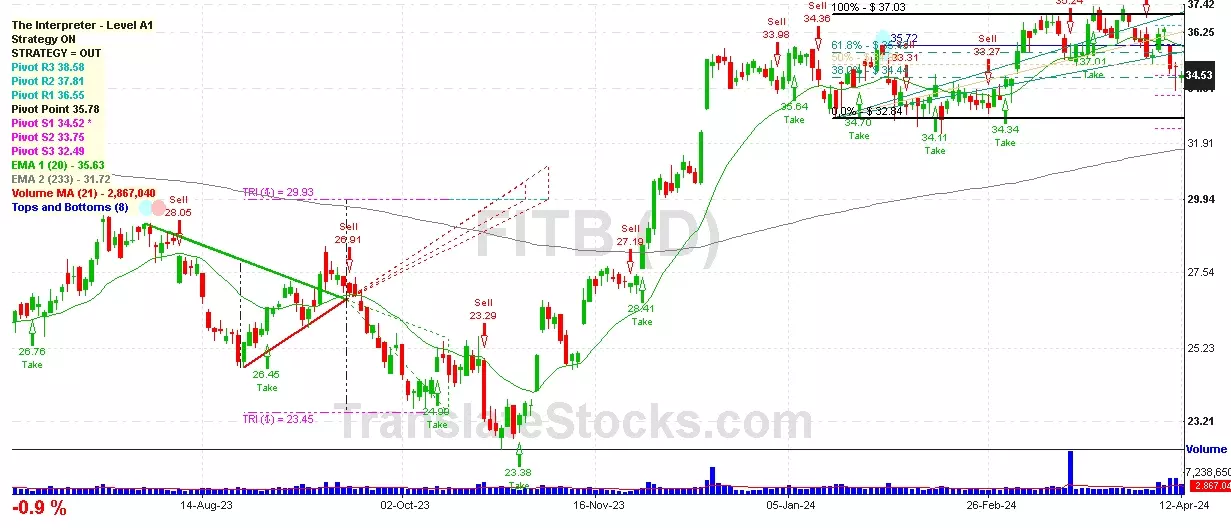
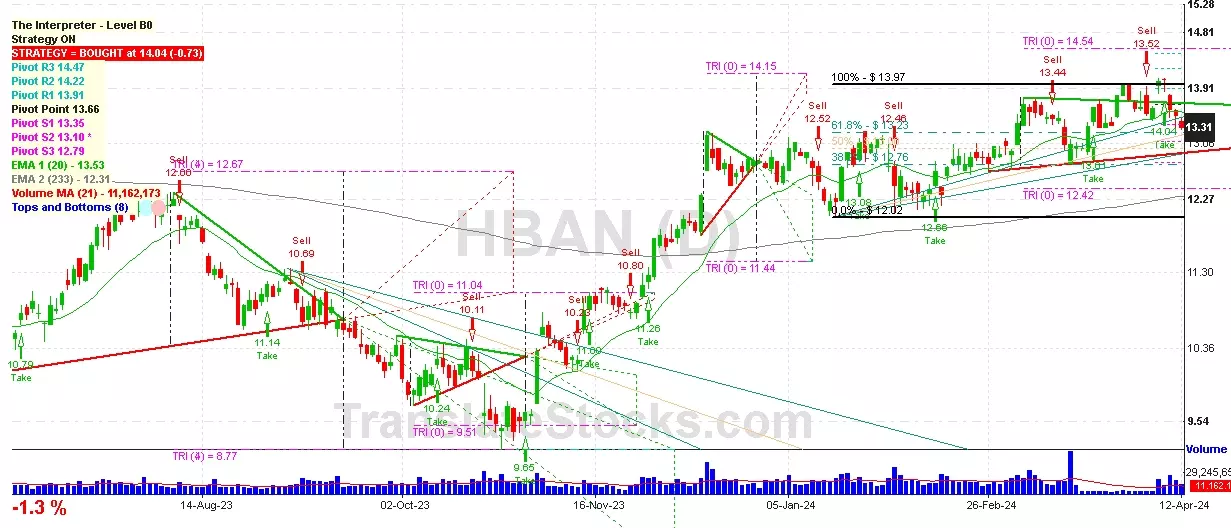