
| Date | Price $ | Result % | Candle Name | Side |
|---|---|---|---|---|
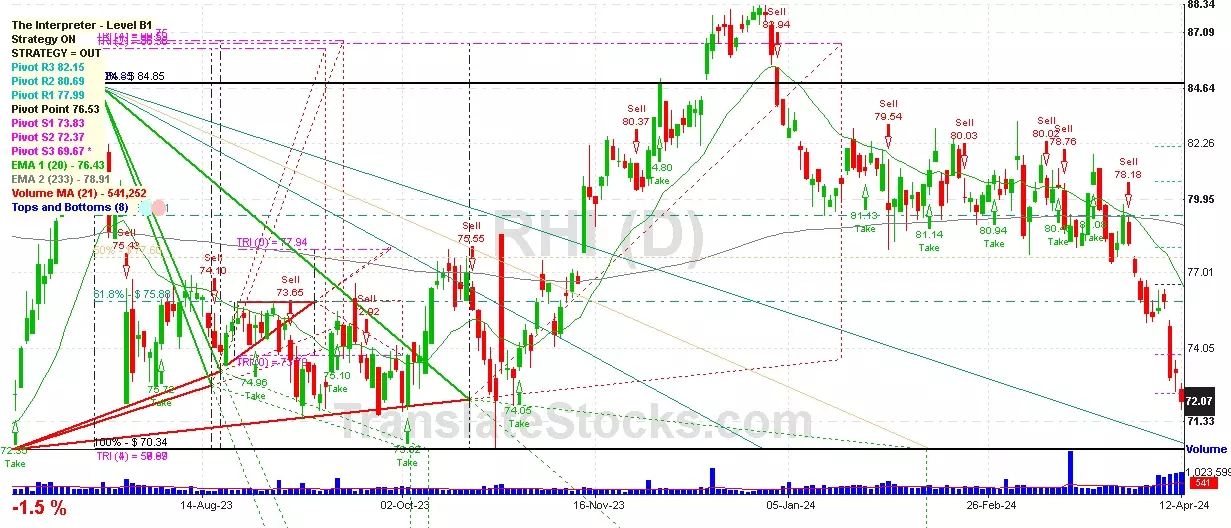
| 001 22 Mar 2024 | Sell Price: 79.74 | Profit: Open Day1 ($ 79.72) | Abandoned Baby | Sell |
| 002 22 Mar 2024 | Sell Price: 79.53 | Profit: Close Day1 ($ 78.35) | Engulfing | Sell |
| 003 14 Mar 2024 | Sell Price: 78.76 | Profit: Open Day1 ($ 78.25) | Abandoned Baby | Sell |
| 004 18 Jan 2024 | Buy Price: 80.41 | Profit: Open Day1 ($ 80.59) | Abandoned Baby | Buy |
| 005 30 Oct 2023 | Buy Price: 74.05 | Profit: Open Day1 ($ 74.23) | Abandoned Baby | Buy |
| 006 20 Sep 2023 | Sell Price: 74.33 | Profit: Open Day1 ($ 73.81) | Dark Cloud Cover | Sell |
| 007 13 Sep 2023 | Buy Price: 72.63 | Profit: Open Day1 ($ 73.19) | Abandoned Baby | Buy |
| 008 24 Aug 2023 | Sell Price: 74.22 | Loss: Close Day2 ($ 74.67) | Abandoned Baby | Sell |
| 009 30 May 2023 | Sell Price: 66.77 | Profit: Open Day1 ($ 66.39) | Engulfing | Sell |
| 010 27 Apr 2023 | Buy Price: 73.13 | Profit: Close Day2 ($ 73.16) | Abandoned Baby | Buy |
| 011One Year Average | Both Sides Result for 10 Signals |
Profit: $ 3.11 ($ 0.31 / Signal) |
All of Them | Buy + Sell |
| Simple Moving Averages (SMA) Period | Value $ | Signal | Exponential Moving Averages (EMA) Period | Value $ | Signal | |
|---|---|---|---|---|---|---|
| 2 | 71.52 | BUY | 2 | 71.36 | BUY | |
| 3 | 71.09 | BUY | 3 | 71.16 | BUY | |
| 5 | 70.43 | BUY | 5 | 71.05 | BUY | |
| 8 | 70.68 | BUY | 8 | 71.36 | BUY | |
| 13 | 72.18 | SELL | 13 | 72.26 | SELL | |
| 21 | 74.20 | SELL | 21 | 73.63 | SELL | |
| 34 | 76.34 | SELL | 34 | 75.24 | SELL | |
| 55 | 77.90 | SELL | 55 | 76.78 | SELL | |
| 90 | 80.05 | SELL | 90 | 77.84 | SELL | |
| 200 | 78.20 | SELL | 200 | 78.20 | SELL |
Robert Half Intl Inc
IPO: 1990-01-22
Ticker: RHIIndices: S&P 500,
Exchange: New York Stock Exchange, Inc. (US - USD)
Website: http://www.rhi.com/
Phone:
Common Stock
Trade & Services (
Services-help Supply Services

 Click to Enlarge