| Date | Price $ | Result % | Candle Name | Side |
|---|---|---|---|---|
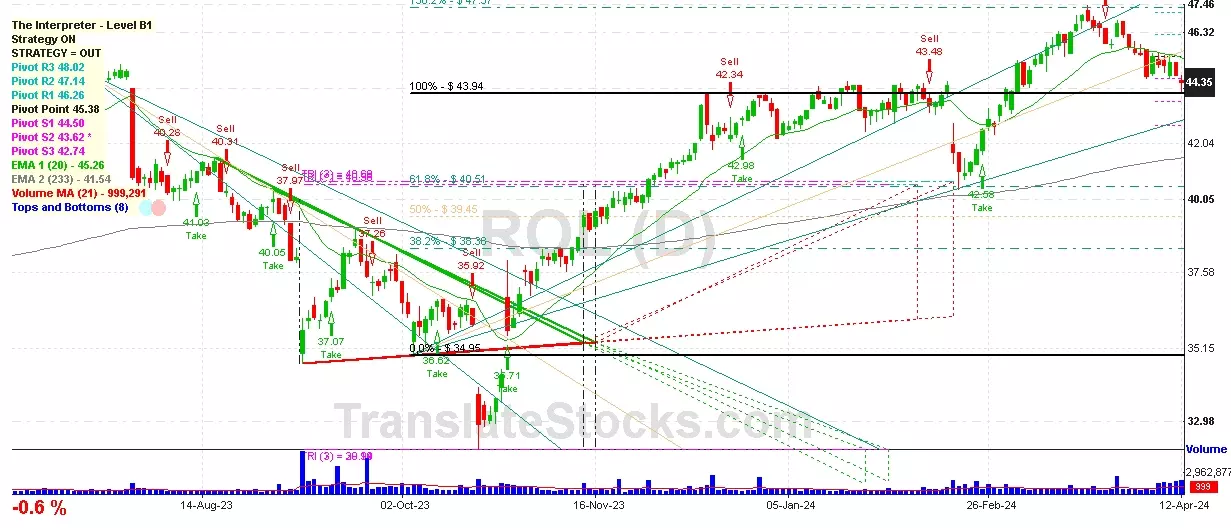
| 001 10 Apr 2024 | Buy Price: 45.24 | Loss: Close Day2 ($ 44.35) | Engulfing | Buy |
| 002 10 Apr 2024 | Buy Price: 45.15 | Loss: Close Day2 ($ 44.35) | Piercing Line | Buy |
| 003 27 Mar 2024 | Buy Price: 46.70 | Profit: Open Day1 ($ 46.78) | Abandoned Baby | Buy |
| 004 15 Mar 2024 | Buy Price: 46.35 | Profit: Open Day1 ($ 46.40) | Engulfing | Buy |
| 005 08 Feb 2024 | Sell Price: 43.73 | Profit: Close Day1 ($ 43.48) | Abandoned Baby | Sell |
| 006 14 Dec 2023 | Sell Price: 42.74 | Profit: Open Day1 ($ 42.35) | Dark Cloud Cover | Sell |
| 007 08 Nov 2023 | Sell Price: 38.09 | Profit: Close Day1 ($ 37.86) | Dark Cloud Cover | Sell |
| 008 08 Sep 2023 | Buy Price: 36.11 | Profit: Open Day1 ($ 36.50) | Abandoned Baby | Buy |
| 009One Year Average | Both Sides Result for 8 Signals |
Loss: $ -0.30 ($ -0.04 / Signal) |
All of Them | Buy + Sell |
| Simple Moving Averages (SMA) Period | Value $ | Signal | Exponential Moving Averages (EMA) Period | Value $ | Signal | |
|---|---|---|---|---|---|---|
| 2 | 42.76 | BUY | 2 | 42.78 | BUY | |
| 3 | 42.66 | BUY | 3 | 42.74 | BUY | |
| 5 | 42.59 | BUY | 5 | 42.80 | BUY | |
| 8 | 42.82 | BUY | 8 | 43.03 | SELL | |
| 13 | 43.60 | SELL | 13 | 43.46 | SELL | |
| 21 | 44.39 | SELL | 21 | 43.93 | SELL | |
| 34 | 45.07 | SELL | 34 | 44.21 | SELL | |
| 55 | 44.37 | SELL | 55 | 44.10 | SELL | |
| 90 | 43.95 | SELL | 90 | 43.53 | SELL | |
| 200 | 41.32 | BUY | 200 | 41.97 | BUY |
Rollins Inc
IPO: 1981-05-22
Ticker: ROLIndices: S&P 500,
Exchange: New York Stock Exchange, Inc. (US - USD)
Website: http://www.rollins.com/
Phone:
Common Stock
Trade & Services (
Services-to Dwellings & Other Buildings

 Click to Enlarge