| Date | Price $ | Result % | Candle Name | Side |
|---|---|---|---|---|
| 001 20 Feb 2024 | Sell Price: 180.01 | Loss: Close Day2 ($ 183.33) | Engulfing | Sell |
| 002 13 Feb 2024 | Buy Price: 175.61 | Profit: Open Day1 ($ 176.32) | Abandoned Baby | Buy |
| 003 03 Jan 2024 | Sell Price: 163.72 | Profit: Close Day2 ($ 163.52) | Dark Cloud Cover | Sell |
| 004 19 Dec 2023 | Sell Price: 162.80 | Profit: Open Day1 ($ 162.39) | Engulfing | Sell |
| 005 03 Oct 2023 | Buy Price: 142.50 | Profit: Open Day1 ($ 142.69) | Engulfing | Buy |
| 006 03 Oct 2023 | Buy Price: 142.36 | Profit: Open Day1 ($ 142.69) | Piercing Line | Buy |
| 007 10 Jul 2023 | Buy Price: 150.89 | Profit: Open Day2 ($ 150.99) | Abandoned Baby | Buy |
| 008 25 Apr 2023 | Sell Price: 138.88 | Profit: Open Day1 ($ 137.66) | Dark Cloud Cover | Sell |
| 009One Year Average | Both Sides Result for 8 Signals |
Loss: $ -0.16 ($ -0.02 / Signal) |
All of Them | Buy + Sell |
| Simple Moving Averages (SMA) Period | Value $ | Signal | Exponential Moving Averages (EMA) Period | Value $ | Signal | |
|---|---|---|---|---|---|---|
| 2 | 189.37 | BUY | 2 | 189.44 | BUY | |
| 3 | 189.23 | BUY | 3 | 189.20 | BUY | |
| 5 | 188.48 | BUY | 5 | 188.93 | BUY | |
| 8 | 188.64 | BUY | 8 | 188.78 | BUY | |
| 13 | 188.53 | BUY | 13 | 188.67 | BUY | |
| 21 | 189.12 | BUY | 21 | 188.23 | BUY | |
| 34 | 187.77 | BUY | 34 | 186.75 | BUY | |
| 55 | 184.36 | BUY | 55 | 183.54 | BUY | |
| 90 | 177.12 | BUY | 90 | 178.19 | BUY | |
| 200 | 162.39 | BUY | 200 | 166.19 | BUY |
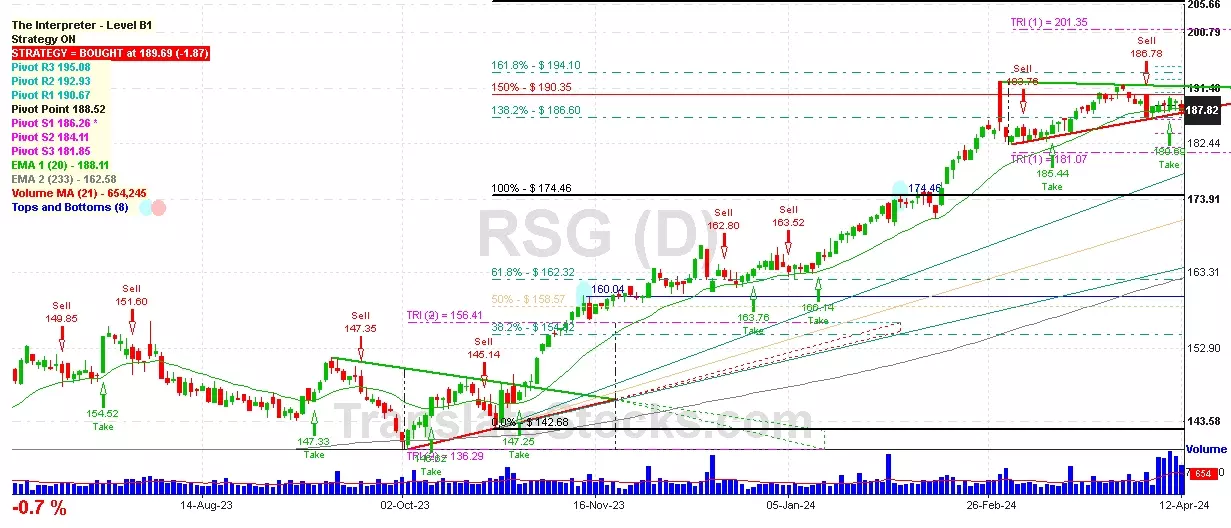
Republic Services Inc
IPO: 1998-07-01
Ticker: RSGIndices: S&P 500,
Exchange: New York Stock Exchange, Inc. (US - USD)
Website: http://www.republicservices.com/
Phone:
Common Stock
Energy & Transportation (
Refuse Systems

 Click to Enlarge