| Date | Price $ | Result % | Candle Name | Side |
|---|---|---|---|---|
| 001 04 Apr 2024 | Sell Price: 213.79 | Profit: Open Day1 ($ 212.00) | Dark Cloud Cover | Sell |
| 002 26 Mar 2024 | Sell Price: 214.21 | Loss: Close Day2 ($ 216.70) | Engulfing | Sell |
| 003 04 Mar 2024 | Buy Price: 212.05 | Profit: Open Day1 ($ 213.05) | Engulfing | Buy |
| 004 16 Feb 2024 | Sell Price: 206.80 | Profit: Open Day1 ($ 206.63) | Abandoned Baby | Sell |
| 005 09 Feb 2024 | Buy Price: 217.45 | Loss: Close Day2 ($ 208.89) | Abandoned Baby | Buy |
| 006 23 Jan 2024 | Sell Price: 233.22 | Profit: Close Day1 ($ 227.28) | Dark Cloud Cover | Sell |
| 007 17 Nov 2023 | Sell Price: 233.71 | Profit: Open Day1 ($ 232.19) | Engulfing | Sell |
| 008 17 Nov 2023 | Sell Price: 233.83 | Profit: Open Day1 ($ 232.19) | Dark Cloud Cover | Sell |
| 009 14 Nov 2023 | Buy Price: 233.65 | Profit: Close Day1 ($ 233.85) | Abandoned Baby | Buy |
| 010 07 Sep 2023 | Buy Price: 221.24 | Profit: Open Day1 ($ 221.96) | Engulfing | Buy |
| 011 25 Jul 2023 | Sell Price: 220.24 | Profit: Open Day1 ($ 220.00) | Abandoned Baby | Sell |
| 012 30 May 2023 | Sell Price: 221.84 | Profit: Open Day1 ($ 221.74) | Engulfing | Sell |
| 013One Year Average | Both Sides Result for 12 Signals |
Profit: $ 2.27 ($ 0.19 / Signal) |
All of Them | Buy + Sell |
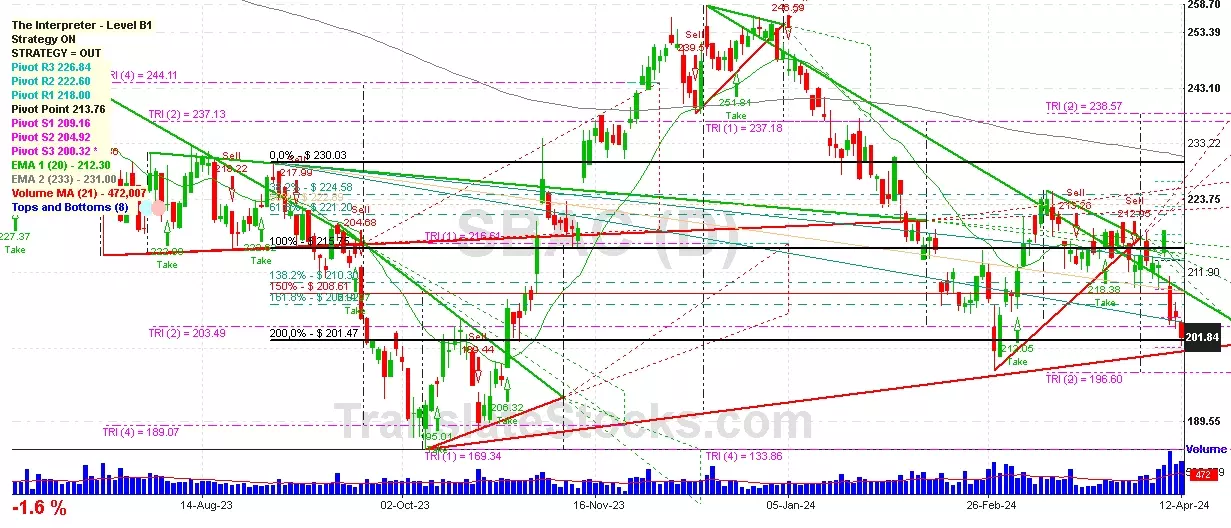
| Simple Moving Averages (SMA) Period | Value $ | Signal | Exponential Moving Averages (EMA) Period | Value $ | Signal | |
|---|---|---|---|---|---|---|
| 2 | 197.55 | BUY | 2 | 197.72 | BUY | |
| 3 | 197.05 | BUY | 3 | 197.44 | BUY | |
| 5 | 196.67 | BUY | 5 | 197.67 | BUY | |
| 8 | 197.51 | BUY | 8 | 199.04 | SELL | |
| 13 | 202.66 | SELL | 13 | 201.67 | SELL | |
| 21 | 207.49 | SELL | 21 | 204.88 | SELL | |
| 34 | 211.35 | SELL | 34 | 208.42 | SELL | |
| 55 | 211.33 | SELL | 55 | 212.49 | SELL | |
| 90 | 222.95 | SELL | 90 | 216.65 | SELL | |
| 200 | 221.33 | SELL | 200 | 225.70 | SELL |
Sba Communications Corp
IPO: 1999-06-16
Ticker: SBACIndices: S&P 500,
Exchange: Nasdaq Nms - Global Market (US - USD)
Website: https://ir.sbasite.com/overview/default.aspx
Phone:
REIT (Real Estate Investment Trust)
Real Estate & Construction (
Real Estate Investment Trusts
 Click to Enlarge