| Date | Price $ | Result % | Candle Name | Side |
|---|---|---|---|---|
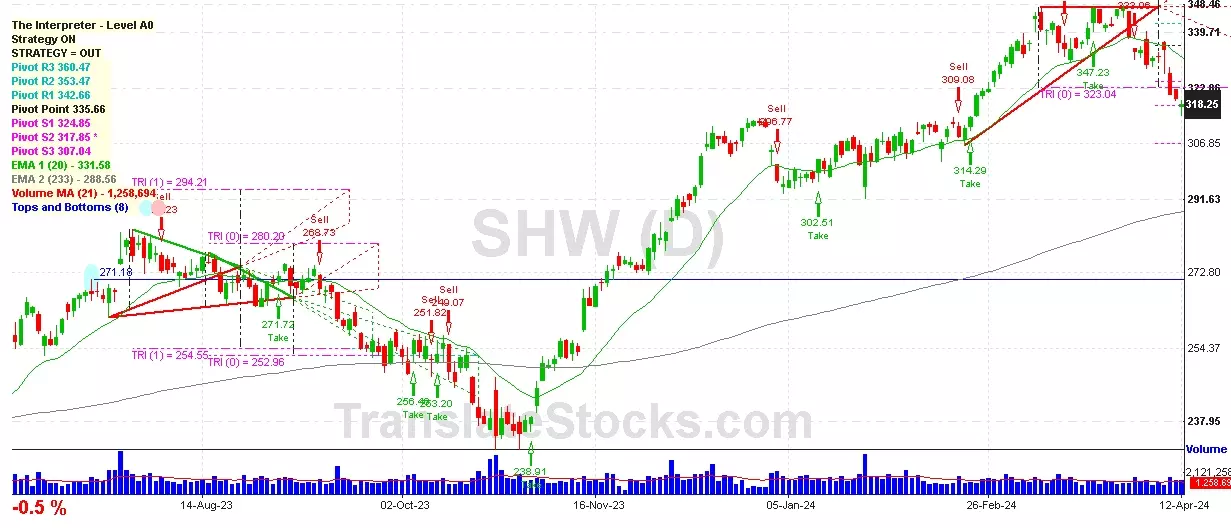
| 001 10 Apr 2024 | Sell Price: 321.16 | Profit: Close Day1 ($ 319.92) | Abandoned Baby | Sell |
| 002 03 Apr 2024 | Buy Price: 334.29 | Profit: Open Day1 ($ 337.64) | Piercing Line | Buy |
| 003 18 Mar 2024 | Buy Price: 335.27 | Profit: Open Day1 ($ 336.35) | Abandoned Baby | Buy |
| 004 23 Jan 2024 | Sell Price: 305.46 | Profit: Close Day1 ($ 301.06) | Dark Cloud Cover | Sell |
| 005 16 Oct 2023 | Buy Price: 252.37 | Profit: Close Day1 ($ 252.84) | Abandoned Baby | Buy |
| 006 10 Oct 2023 | Buy Price: 253.20 | Profit: Open Day1 ($ 254.46) | Engulfing | Buy |
| 007 19 Sep 2023 | Buy Price: 261.42 | Profit: Open Day1 ($ 263.08) | Engulfing | Buy |
| 008 19 Sep 2023 | Buy Price: 261.20 | Profit: Open Day1 ($ 263.08) | Piercing Line | Buy |
| 009 18 Aug 2023 | Buy Price: 270.15 | Profit: Open Day1 ($ 270.34) | Piercing Line | Buy |
| 010 16 Jun 2023 | Sell Price: 247.89 | Profit: Open Day1 ($ 245.33) | Dark Cloud Cover | Sell |
| 011One Year Average | Both Sides Result for 10 Signals |
Profit: $ 18.09 ($ 1.81 / Signal) |
All of Them | Buy + Sell |
| Simple Moving Averages (SMA) Period | Value $ | Signal | Exponential Moving Averages (EMA) Period | Value $ | Signal | |
|---|---|---|---|---|---|---|
| 2 | 309.27 | BUY | 2 | 310.39 | SELL | |
| 3 | 310.84 | SELL | 3 | 311.54 | SELL | |
| 5 | 314.14 | SELL | 5 | 314.33 | SELL | |
| 8 | 319.84 | SELL | 8 | 318.19 | SELL | |
| 13 | 325.14 | SELL | 13 | 322.80 | SELL | |
| 21 | 332.04 | SELL | 21 | 326.43 | SELL | |
| 34 | 334.03 | SELL | 34 | 327.17 | SELL | |
| 55 | 326.05 | SELL | 55 | 323.52 | SELL | |
| 90 | 317.08 | SELL | 90 | 314.77 | SELL | |
| 200 | 287.34 | BUY | 200 | 293.13 | BUY |
Sherwin-williams Co/the
IPO: 1964-02-11
Ticker: SHWIndices: S&P 500,
Exchange: New York Stock Exchange, Inc. (US - USD)
Website: https://www.sherwin-williams.com/
Phone:
Common Stock
Trade & Services (
Retail-building Materials, Hardware, Garden Supply

 Click to Enlarge