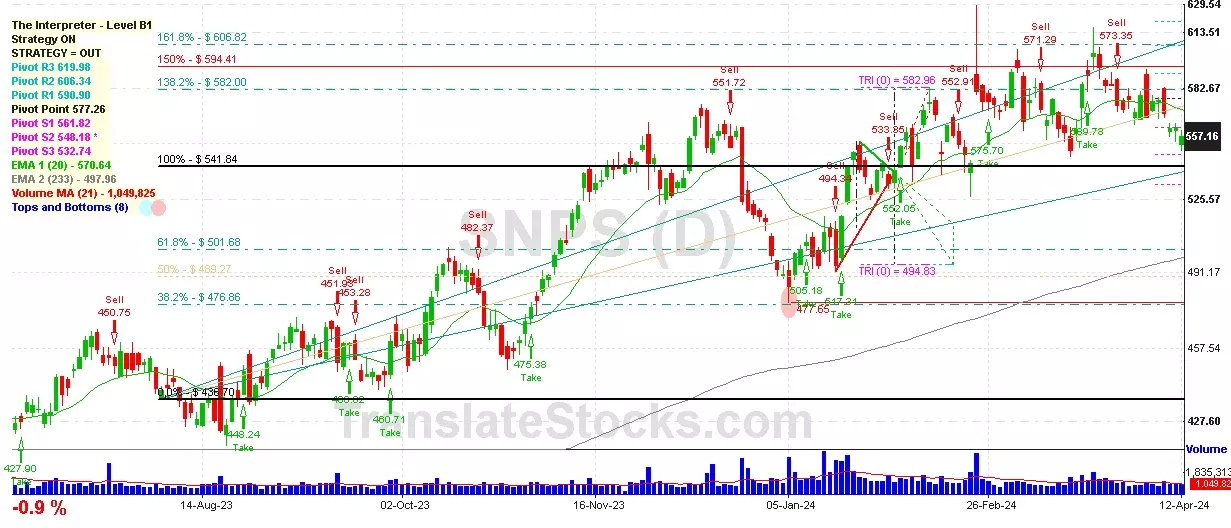
Hey Friend, I'm analysing SYNOPSYS INC (SNPS), and it is between the Support of $ 548.18 (PivotS2) and the Resistance of $ 561.82 (PivotS1). The stock is also approaching the line of PivotS1 at $ 561.82, and if it goes above this line it could reach the next Resistance of 138.2% of Fibonacci at $ 582.00.

| Date | Price $ | Result % | Candle Name | Side |
|---|---|---|---|---|
| 001 04 Apr 2024 | Sell Price: 567.29 | Loss: Close Day2 ($ 576.36) | Engulfing | Sell |
| 002 04 Apr 2024 | Sell Price: 567.11 | Loss: Close Day2 ($ 576.36) | Dark Cloud Cover | Sell |
| 003 18 Mar 2024 | Buy Price: 560.63 | Profit: Open Day1 ($ 572.18) | Abandoned Baby | Buy |
| 004 08 Mar 2024 | Sell Price: 571.29 | Profit: Open Day1 ($ 562.99) | Engulfing | Sell |
| 005 12 Feb 2024 | Sell Price: 568.93 | Profit: Open Day1 ($ 549.07) | Engulfing | Sell |
| 006 11 Jan 2024 | Sell Price: 498.46 | Profit: Close Day1 ($ 494.40) | Engulfing | Sell |
| 007 19 Dec 2023 | Sell Price: 558.18 | Profit: Open Day1 ($ 557.27) | Engulfing | Sell |
| 008 19 Dec 2023 | Sell Price: 558.65 | Profit: Open Day1 ($ 557.27) | Dark Cloud Cover | Sell |
| 009 05 Dec 2023 | Buy Price: 535.71 | Profit: Open Day1 ($ 538.66) | Piercing Line | Buy |
| 010One Year Average | Both Sides Result for 9 Signals |
Profit: $ 30.69 ($ 3.41 / Signal) |
All of Them | Buy + Sell |
| Simple Moving Averages (SMA) Period | Value $ | Signal | Exponential Moving Averages (EMA) Period | Value $ | Signal | |
|---|---|---|---|---|---|---|
| 2 | 521.50 | BUY | 2 | 523.46 | BUY | |
| 3 | 517.90 | BUY | 3 | 522.51 | BUY | |
| 5 | 520.20 | BUY | 5 | 524.76 | BUY | |
| 8 | 530.39 | SELL | 8 | 530.73 | SELL | |
| 13 | 545.17 | SELL | 13 | 539.59 | SELL | |
| 21 | 556.83 | SELL | 21 | 548.48 | SELL | |
| 34 | 563.76 | SELL | 34 | 554.36 | SELL | |
| 55 | 564.61 | SELL | 55 | 554.43 | SELL | |
| 90 | 549.49 | SELL | 90 | 546.26 | SELL | |
| 200 | 508.16 | BUY | 200 | 509.76 | BUY |
Synopsys Inc
IPO: 1992-02-26
Ticker: SNPSIndices: S&P 500,
Nasdaq 100,
Exchange: Nasdaq Nms - Global Market (US - USD)
Website: https://www.synopsys.com/
Phone:
Common Stock
Technology (
Services-prepackaged Software
 Click to Enlarge