| Date | Price $ | Result % | Candle Name | Side |
|---|---|---|---|---|
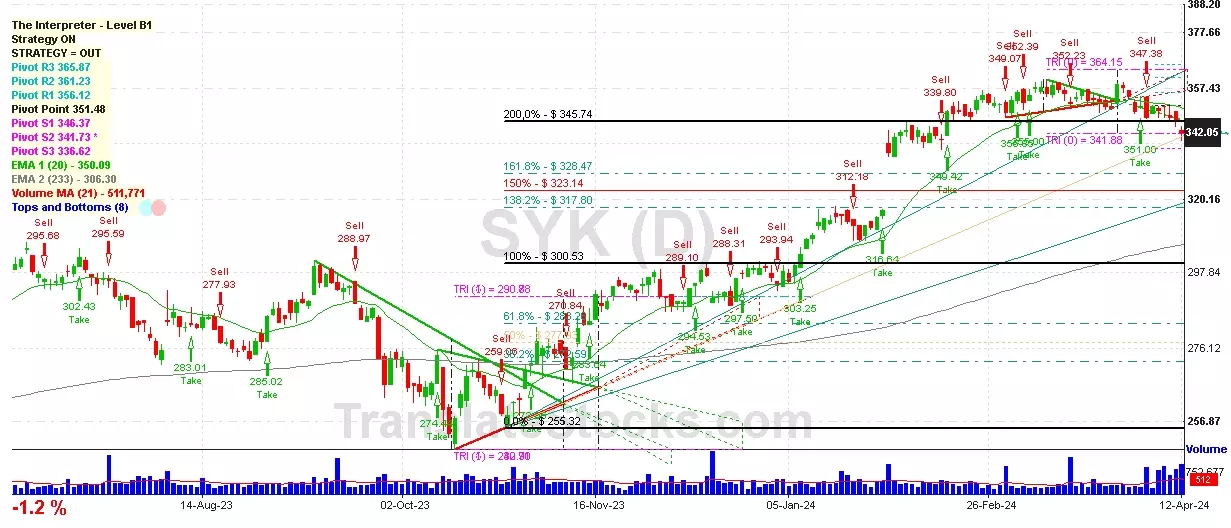
| 001 04 Apr 2024 | Sell Price: 347.38 | Loss: Close Day2 ($ 349.75) | Engulfing | Sell |
| 002 20 Mar 2024 | Sell Price: 353.19 | Profit: Close Day2 ($ 352.62) | Engulfing | Sell |
| 003 12 Mar 2024 | Buy Price: 358.39 | Profit: Open Day1 ($ 359.63) | Engulfing | Buy |
| 004 04 Jan 2024 | Buy Price: 298.05 | Profit: Close Day2 ($ 299.91) | Engulfing | Buy |
| 005 02 Jan 2024 | Sell Price: 296.23 | Profit: Open Day1 ($ 295.07) | Abandoned Baby | Sell |
| 006 29 Nov 2023 | Buy Price: 294.37 | Profit: Close Day1 ($ 296.33) | Abandoned Baby | Buy |
| 007 27 Nov 2023 | Buy Price: 293.96 | Profit: Open Day2 ($ 294.00) | Piercing Line | Buy |
| 008 31 Aug 2023 | Sell Price: 283.55 | Loss: Close Day2 ($ 286.29) | Engulfing | Sell |
| 009 23 Aug 2023 | Buy Price: 275.96 | Profit: Close Day2 ($ 278.12) | Abandoned Baby | Buy |
| 010 14 Aug 2023 | Buy Price: 284.79 | Profit: Close Day1 ($ 284.86) | Engulfing | Buy |
| 011 23 May 2023 | Sell Price: 274.16 | Profit: Open Day1 ($ 273.00) | Abandoned Baby | Sell |
| 012 12 May 2023 | Buy Price: 285.47 | Profit: Open Day1 ($ 285.62) | Abandoned Baby | Buy |
| 013One Year Average | Both Sides Result for 12 Signals |
Profit: $ 5.26 ($ 0.44 / Signal) |
All of Them | Buy + Sell |
| Simple Moving Averages (SMA) Period | Value $ | Signal | Exponential Moving Averages (EMA) Period | Value $ | Signal | |
|---|---|---|---|---|---|---|
| 2 | 326.56 | BUY | 2 | 327.50 | BUY | |
| 3 | 326.85 | BUY | 3 | 328.37 | SELL | |
| 5 | 330.85 | SELL | 5 | 330.77 | SELL | |
| 8 | 335.22 | SELL | 8 | 334.12 | SELL | |
| 13 | 340.62 | SELL | 13 | 338.22 | SELL | |
| 21 | 345.42 | SELL | 21 | 341.97 | SELL | |
| 34 | 349.21 | SELL | 34 | 343.60 | SELL | |
| 55 | 348.51 | SELL | 55 | 340.66 | SELL | |
| 90 | 331.65 | SELL | 90 | 332.32 | SELL | |
| 200 | 304.31 | BUY | 200 | 311.92 | BUY |
Stryker Corp
IPO: 1997-07-24
Ticker: SYKIndices: S&P 500,
Exchange: New York Stock Exchange, Inc. (US - USD)
Website: https://www.stryker.com/
Phone:
Common Stock
Life Sciences (
Surgical & Medical Instruments & Apparatus

 Click to Enlarge