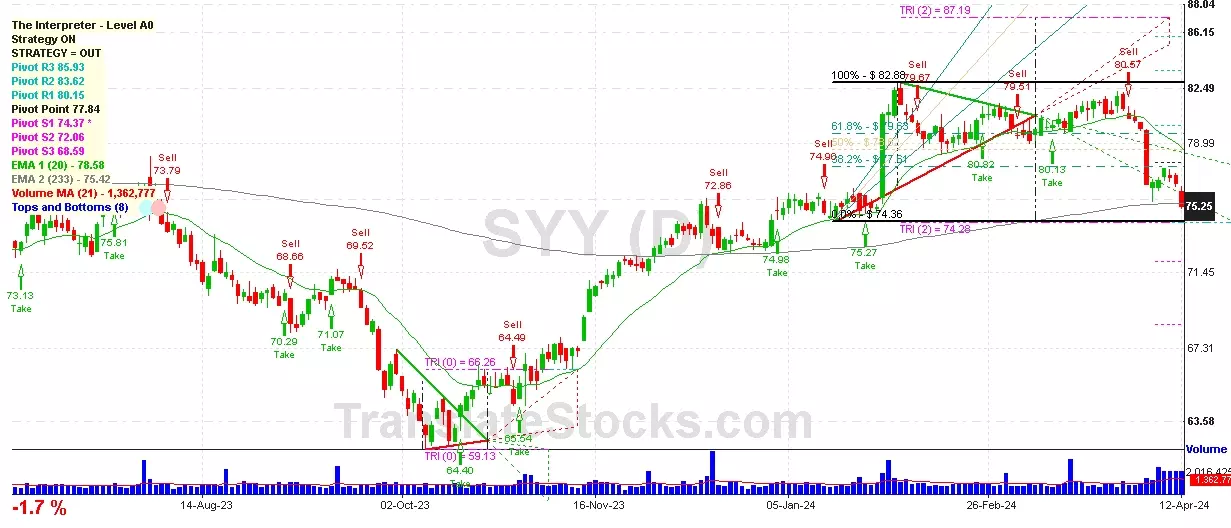
Hey Friend, I'm analysing SYSCO CORP (SYY), and it is between the Support of $ 74.37 (PivotS1) and the Resistance of $ 77.84 (Pivot). The stock is also approaching the line of PivotS1 at $ 74.37, and if it goes below this line it could reach the next Support of Triangle projection at $74.28.

| Date | Price $ | Result % | Candle Name | Side |
|---|---|---|---|---|
| 001 15 Mar 2024 | Buy Price: 80.92 | Profit: Open Day1 ($ 81.01) | Engulfing | Buy |
| 002 05 Mar 2024 | Buy Price: 79.58 | Profit: Open Day1 ($ 79.78) | Abandoned Baby | Buy |
| 003 23 Jan 2024 | Sell Price: 75.52 | Profit: Close Day1 ($ 74.99) | Dark Cloud Cover | Sell |
| 004 18 Jan 2024 | Buy Price: 75.20 | Profit: Open Day1 ($ 75.43) | Abandoned Baby | Buy |
| 005 18 Jan 2024 | Buy Price: 75.16 | Profit: Open Day1 ($ 75.43) | Engulfing | Buy |
| 006 20 Oct 2023 | Sell Price: 65.43 | Profit: Open Day1 ($ 65.00) | Dark Cloud Cover | Sell |
| 007 09 Oct 2023 | Buy Price: 63.43 | Profit: Open Day1 ($ 63.68) | Engulfing | Buy |
| 008 29 Sep 2023 | Sell Price: 66.05 | Profit: Open Day1 ($ 66.01) | Dark Cloud Cover | Sell |
| 009 12 Sep 2023 | Sell Price: 69.95 | Profit: Close Day1 ($ 69.91) | Engulfing | Sell |
| 010 12 Sep 2023 | Sell Price: 70.03 | Profit: Close Day1 ($ 69.91) | Dark Cloud Cover | Sell |
| 011 07 Sep 2023 | Buy Price: 69.16 | Profit: Open Day1 ($ 69.19) | Abandoned Baby | Buy |
| 012 27 Jun 2023 | Buy Price: 73.38 | Loss: Close Day2 ($ 73.13) | Engulfing | Buy |
| 013 12 Jun 2023 | Sell Price: 72.33 | Profit: Open Day1 ($ 72.02) | Dark Cloud Cover | Sell |
| 014 08 May 2023 | Sell Price: 76.08 | Profit: Open Day1 ($ 75.92) | Engulfing | Sell |
| 015 08 May 2023 | Sell Price: 76.04 | Profit: Open Day1 ($ 75.92) | Dark Cloud Cover | Sell |
| 016One Year Average | Both Sides Result for 15 Signals |
Profit: $ 2.58 ($ 0.17 / Signal) |
All of Them | Buy + Sell |
| Simple Moving Averages (SMA) Period | Value $ | Signal | Exponential Moving Averages (EMA) Period | Value $ | Signal | |
|---|---|---|---|---|---|---|
| 2 | 77.14 | SELL | 2 | 76.97 | SELL | |
| 3 | 77.00 | SELL | 3 | 76.86 | BUY | |
| 5 | 76.42 | BUY | 5 | 76.66 | BUY | |
| 8 | 76.10 | BUY | 8 | 76.63 | BUY | |
| 13 | 76.41 | BUY | 13 | 76.93 | BUY | |
| 21 | 77.89 | SELL | 21 | 77.52 | SELL | |
| 34 | 78.92 | SELL | 34 | 78.05 | SELL | |
| 55 | 79.32 | SELL | 55 | 78.03 | SELL | |
| 90 | 77.78 | SELL | 90 | 77.19 | SELL | |
| 200 | 73.47 | BUY | 200 | 75.58 | BUY |
Sysco Corp
IPO: 1981-01-20
Ticker: SYYIndices: S&P 500,
Exchange: New York Stock Exchange, Inc. (US - USD)
Website: https://www.sysco.com/
Phone:
Common Stock
Trade & Services (
Wholesale-groceries & Related Products
 Click to Enlarge