| Date | Price $ | Result % | Candle Name | Side |
|---|---|---|---|---|
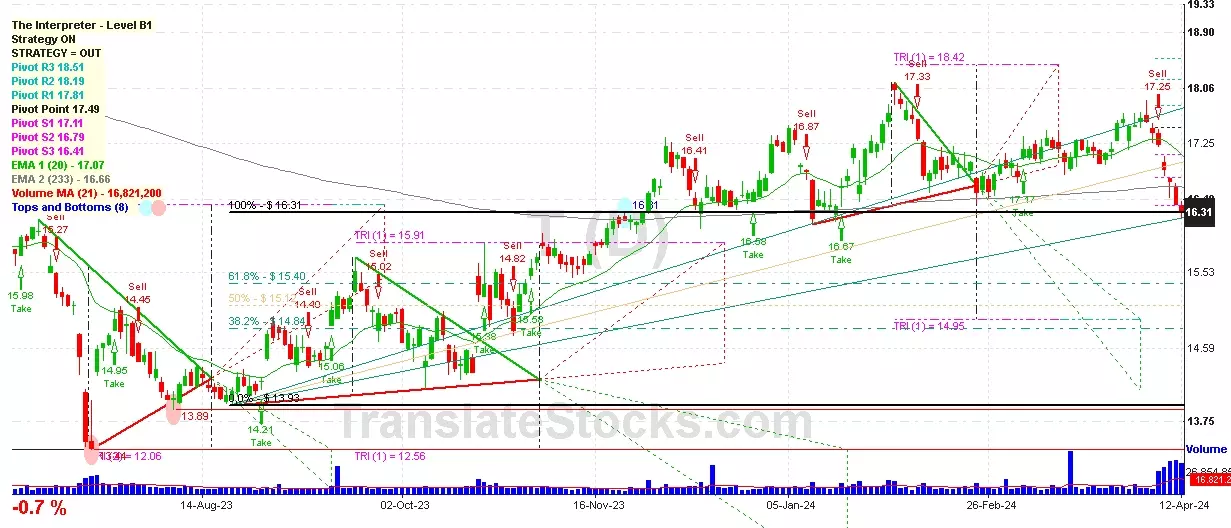
| 001 04 Apr 2024 | Sell Price: 17.57 | Profit: Open Day1 ($ 17.52) | Engulfing | Sell |
| 002 04 Apr 2024 | Sell Price: 17.59 | Profit: Open Day1 ($ 17.52) | Dark Cloud Cover | Sell |
| 003 22 Feb 2024 | Sell Price: 16.59 | Loss: Close Day2 ($ 16.60) | Abandoned Baby | Sell |
| 004 21 Feb 2024 | Buy Price: 17.00 | Loss: Close Day2 ($ 16.80) | Abandoned Baby | Buy |
| 005 19 Dec 2023 | Buy Price: 16.61 | Loss: Close Day2 ($ 16.49) | Engulfing | Buy |
| 006 29 Nov 2023 | Buy Price: 16.30 | Profit: Close Day1 ($ 16.57) | Abandoned Baby | Buy |
| 007 14 Nov 2023 | Buy Price: 15.63 | Profit: Open Day1 ($ 15.65) | Abandoned Baby | Buy |
| 008 07 Nov 2023 | Buy Price: 15.84 | Loss: Close Day2 ($ 15.63) | Engulfing | Buy |
| 009 05 Oct 2023 | Buy Price: 14.83 | Loss: Close Day2 ($ 14.73) | Engulfing | Buy |
| 010 25 Jul 2023 | Sell Price: 14.78 | Profit: Close Day2 ($ 14.51) | Engulfing | Sell |
| 011 25 Jul 2023 | Sell Price: 14.80 | Profit: Close Day2 ($ 14.51) | Dark Cloud Cover | Sell |
| 012 20 Jun 2023 | Sell Price: 15.78 | Profit: Open Day1 ($ 15.70) | Abandoned Baby | Sell |
| 013 02 Jun 2023 | Sell Price: 15.21 | Loss: Close Day2 ($ 15.67) | Abandoned Baby | Sell |
| 014 12 May 2023 | Buy Price: 17.03 | Loss: Close Day2 ($ 16.53) | Abandoned Baby | Buy |
| 015One Year Average | Both Sides Result for 14 Signals |
Loss: $ -0.56 ($ -0.04 / Signal) |
All of Them | Buy + Sell |
| Simple Moving Averages (SMA) Period | Value $ | Signal | Exponential Moving Averages (EMA) Period | Value $ | Signal | |
|---|---|---|---|---|---|---|
| 2 | 16.41 | BUY | 2 | 16.45 | BUY | |
| 3 | 16.44 | BUY | 3 | 16.42 | BUY | |
| 5 | 16.35 | BUY | 5 | 16.40 | BUY | |
| 8 | 16.30 | BUY | 8 | 16.44 | BUY | |
| 13 | 16.55 | SELL | 13 | 16.56 | SELL | |
| 21 | 16.89 | SELL | 21 | 16.71 | SELL | |
| 34 | 16.99 | SELL | 34 | 16.83 | SELL | |
| 55 | 16.99 | SELL | 55 | 16.87 | SELL | |
| 90 | 16.95 | SELL | 90 | 16.77 | SELL | |
| 200 | 15.91 | BUY | 200 | 16.65 | SELL |
At&t Inc
IPO: 1983-11-21
Ticker: TIndices: S&P 500,
Exchange: New York Stock Exchange, Inc. (US - USD)
Website: https://www.att.com/
Phone:
Common Stock
Technology (
Telephone Communications (no Radiotelephone)

 Click to Enlarge