| Date | Price $ | Result % | Candle Name | Side |
|---|---|---|---|---|
| 001 04 Apr 2024 | Sell Price: 1,204.92 | Loss: Close Day2 ($ 1,233.29) | Engulfing | Sell |
| 002 04 Apr 2024 | Sell Price: 1,204.36 | Loss: Close Day2 ($ 1,233.29) | Dark Cloud Cover | Sell |
| 003 03 Apr 2024 | Buy Price: 1,230.96 | Profit: Open Day1 ($ 1,242.04) | Abandoned Baby | Buy |
| 004 03 Apr 2024 | Buy Price: 1,228.51 | Profit: Open Day1 ($ 1,242.04) | Engulfing | Buy |
| 005 04 Mar 2024 | Sell Price: 1,173.99 | Profit: Open Day1 ($ 1,172.27) | Abandoned Baby | Sell |
| 006 04 Mar 2024 | Sell Price: 1,173.41 | Profit: Open Day1 ($ 1,172.27) | Engulfing | Sell |
| 007 13 Feb 2024 | Buy Price: 1,122.26 | Profit: Open Day1 ($ 1,135.38) | Engulfing | Buy |
| 008 13 Feb 2024 | Buy Price: 1,121.01 | Profit: Open Day1 ($ 1,135.38) | Piercing Line | Buy |
| 009 29 Jan 2024 | Sell Price: 1,081.73 | Profit: Open Day1 ($ 1,081.49) | Engulfing | Sell |
| 010 17 Jan 2024 | Buy Price: 1,031.75 | Profit: Open Day1 ($ 1,035.71) | Engulfing | Buy |
| 011 18 Dec 2023 | Buy Price: 989.89 | Profit: Open Day1 ($ 992.63) | Abandoned Baby | Buy |
| 012 25 Oct 2023 | Sell Price: 818.28 | Profit: Close Day1 ($ 818.00) | Abandoned Baby | Sell |
| 013 28 Sep 2023 | Sell Price: 848.37 | Profit: Close Day1 ($ 843.13) | Dark Cloud Cover | Sell |
| 014 05 Sep 2023 | Sell Price: 889.16 | Profit: Close Day1 ($ 882.98) | Engulfing | Sell |
| 015 18 Aug 2023 | Buy Price: 857.13 | Profit: Open Day1 ($ 857.67) | Piercing Line | Buy |
| 016 03 Aug 2023 | Buy Price: 898.24 | Profit: Open Day2 ($ 901.00) | Engulfing | Buy |
| 017 03 Aug 2023 | Buy Price: 895.58 | Profit: Open Day1 ($ 897.39) | Piercing Line | Buy |
| 018 19 May 2023 | Sell Price: 822.51 | Profit: Close Day1 ($ 807.90) | Dark Cloud Cover | Sell |
| 019One Year Average | Both Sides Result for 18 Signals |
Profit: $ 36.02 ($ 2.00 / Signal) |
All of Them | Buy + Sell |
| Simple Moving Averages (SMA) Period | Value $ | Signal | Exponential Moving Averages (EMA) Period | Value $ | Signal | |
|---|---|---|---|---|---|---|
| 2 | 1,221.67 | BUY | 2 | 1,228.19 | BUY | |
| 3 | 1,210.34 | BUY | 3 | 1,222.15 | BUY | |
| 5 | 1,214.05 | BUY | 5 | 1,218.19 | BUY | |
| 8 | 1,215.16 | BUY | 8 | 1,217.27 | BUY | |
| 13 | 1,220.05 | BUY | 13 | 1,216.91 | BUY | |
| 21 | 1,220.15 | BUY | 21 | 1,213.72 | BUY | |
| 34 | 1,208.01 | BUY | 34 | 1,202.54 | BUY | |
| 55 | 1,188.55 | BUY | 55 | 1,176.98 | BUY | |
| 90 | 1,126.41 | BUY | 90 | 1,132.07 | BUY | |
| 200 | 996.16 | BUY | 200 | 1,022.42 | BUY |
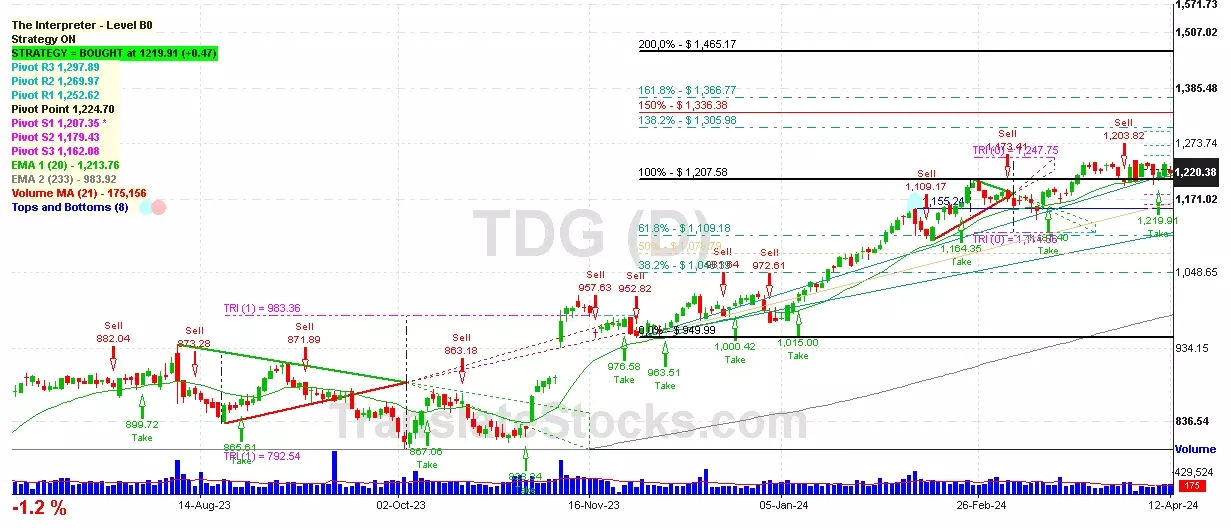
Transdigm Group Inc
IPO: 2006-03-15
Ticker: TDGIndices: S&P 500,
Exchange: New York Stock Exchange, Inc. (US - USD)
Website: https://www.transdigm.com/
Phone:
Common Stock
Manufacturing (
Aircraft Parts & Auxiliary Equipment, Nec

 Click to Enlarge