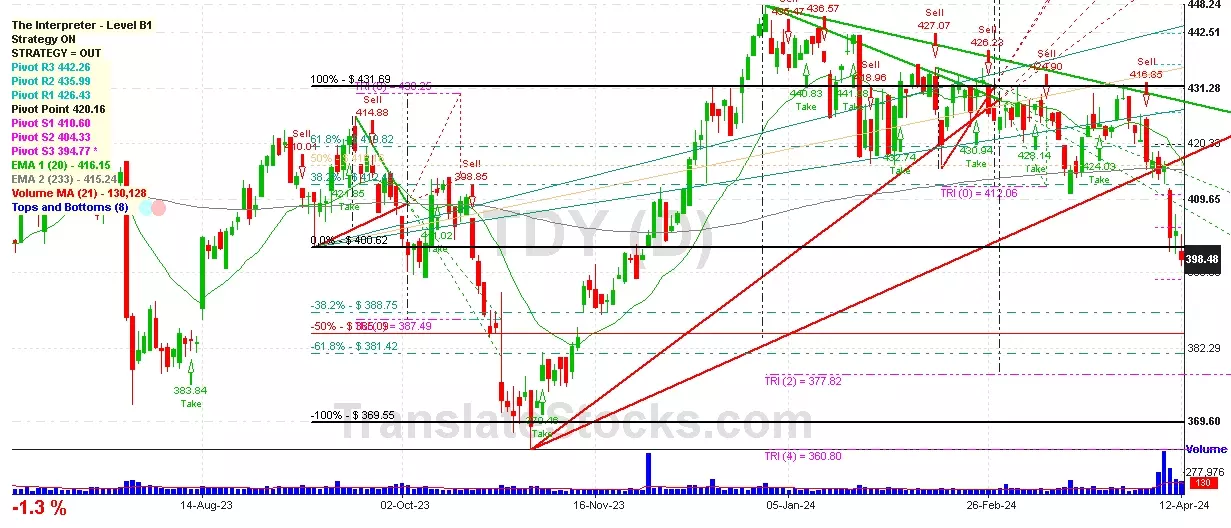
Hey Friend, I'm analysing TELEDYNE TECHNOLOGIES INC (TDY), and it is between the Support of $ 394.77 (PivotS3) and the Resistance of $ 400.62 (0% of Fibonacci). The stock is also approaching the line of PivotS3 at $ 394.77, and if it goes below this line it could reach the next Support of -38.2% of Fibonacci at $ 388.75.

| Date | Price $ | Result % | Candle Name | Side |
|---|---|---|---|---|
| 001 01 Apr 2024 | Sell Price: 424.93 | Profit: Open Day1 ($ 423.85) | Engulfing | Sell |
| 002 26 Feb 2024 | Sell Price: 426.23 | Profit: Close Day1 ($ 424.90) | Abandoned Baby | Sell |
| 003 09 Feb 2024 | Buy Price: 433.55 | Profit: Open Day1 ($ 433.70) | Abandoned Baby | Buy |
| 004 09 Feb 2024 | Buy Price: 434.03 | Loss: Close Day2 ($ 420.19) | Engulfing | Buy |
| 005 07 Feb 2024 | Sell Price: 431.56 | Profit: Close Day1 ($ 430.67) | Engulfing | Sell |
| 006 07 Feb 2024 | Sell Price: 432.09 | Profit: Close Day1 ($ 430.67) | Dark Cloud Cover | Sell |
| 007 03 Jan 2024 | Buy Price: 439.34 | Profit: Open Day1 ($ 440.60) | Piercing Line | Buy |
| 008 06 Nov 2023 | Sell Price: 376.32 | Loss: Close Day2 ($ 378.78) | Engulfing | Sell |
| 009 06 Nov 2023 | Sell Price: 377.18 | Profit: Open Day1 ($ 376.82) | Dark Cloud Cover | Sell |
| 010 13 Sep 2023 | Buy Price: 409.35 | Profit: Open Day1 ($ 411.30) | Abandoned Baby | Buy |
| 011 26 Jul 2023 | Sell Price: 387.87 | Profit: Close Day1 ($ 378.77) | Engulfing | Sell |
| 012 06 Jul 2023 | Buy Price: 407.69 | Profit: Close Day1 ($ 409.97) | Engulfing | Buy |
| 013 06 Jul 2023 | Buy Price: 408.14 | Profit: Close Day1 ($ 409.97) | Piercing Line | Buy |
| 014 09 May 2023 | Sell Price: 410.58 | Loss: Close Day2 ($ 413.64) | Abandoned Baby | Sell |
| 015 02 May 2023 | Sell Price: 413.00 | Profit: Close Day1 ($ 411.06) | Abandoned Baby | Sell |
| 016 27 Apr 2023 | Buy Price: 410.99 | Profit: Close Day1 ($ 414.40) | Engulfing | Buy |
| 017One Year Average | Both Sides Result for 16 Signals |
Profit: $ 7.64 ($ 0.48 / Signal) |
All of Them | Buy + Sell |
| Simple Moving Averages (SMA) Period | Value $ | Signal | Exponential Moving Averages (EMA) Period | Value $ | Signal | |
|---|---|---|---|---|---|---|
| 2 | 384.78 | SELL | 2 | 376.91 | SELL | |
| 3 | 391.21 | SELL | 3 | 383.64 | SELL | |
| 5 | 395.03 | SELL | 5 | 390.09 | SELL | |
| 8 | 397.05 | SELL | 8 | 394.92 | SELL | |
| 13 | 400.90 | SELL | 13 | 399.98 | SELL | |
| 21 | 409.31 | SELL | 21 | 405.33 | SELL | |
| 34 | 414.14 | SELL | 34 | 410.66 | SELL | |
| 55 | 419.58 | SELL | 55 | 414.79 | SELL | |
| 90 | 424.77 | SELL | 90 | 416.39 | SELL | |
| 200 | 411.36 | SELL | 200 | 414.42 | SELL |
Teledyne Technologies Inc
IPO: 1999-11-23
Ticker: TDYIndices: S&P 500,
Exchange: New York Stock Exchange, Inc. (US - USD)
Website: http://teledyne.com/
Phone:
Common Stock
Manufacturing (
Search, Detection, Navagation, Guidance, Aeronautical Sys
 Click to Enlarge