
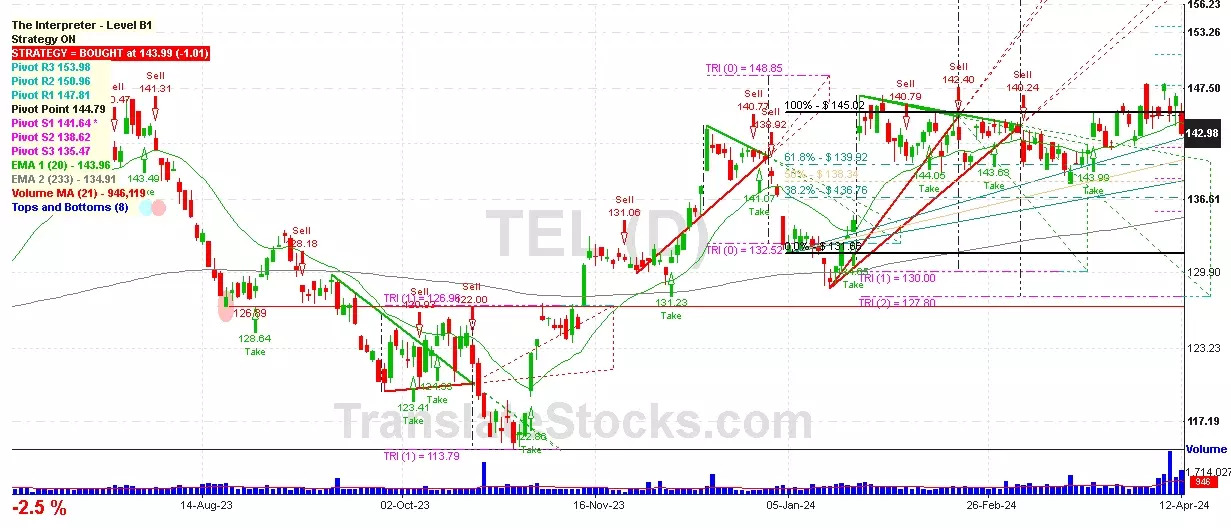
Hey Friend, I'm analysing TE CONNECTIVITY LTD (TEL), and it is between the Support of $ 141.64 (PivotS1) and the Resistance of $ 144.79 (Pivot). The stock is also approaching the line of PivotS1 at $ 141.64, and if it goes below this line it could reach the next Support of 61.8% of Fibonacci at $ 139.92.

| Date | Price $ | Result % | Candle Name | Side |
|---|---|---|---|---|
| 001 04 Apr 2024 | Sell Price: 144.48 | Loss: Close Day2 ($ 144.78) | Dark Cloud Cover | Sell |
| 002 01 Apr 2024 | Sell Price: 143.96 | Profit: Open Day1 ($ 142.29) | Abandoned Baby | Sell |
| 003 23 Feb 2024 | Sell Price: 143.11 | Profit: Close Day1 ($ 142.79) | Engulfing | Sell |
| 004 23 Feb 2024 | Sell Price: 143.22 | Profit: Open Day1 ($ 143.17) | Dark Cloud Cover | Sell |
| 005 16 Feb 2024 | Sell Price: 142.40 | Profit: Open Day1 ($ 141.04) | Engulfing | Sell |
| 006 18 Jan 2024 | Buy Price: 130.46 | Profit: Open Day1 ($ 131.16) | Abandoned Baby | Buy |
| 007 08 Jan 2024 | Buy Price: 133.85 | Loss: Close Day2 ($ 133.17) | Abandoned Baby | Buy |
| 008 07 Nov 2023 | Sell Price: 125.04 | Profit: Close Day2 ($ 124.10) | Abandoned Baby | Sell |
| 009 24 Oct 2023 | Buy Price: 118.06 | Loss: Close Day2 ($ 117.55) | Abandoned Baby | Buy |
| 010 11 Sep 2023 | Buy Price: 128.39 | Profit: Close Day1 ($ 128.47) | Abandoned Baby | Buy |
| 011 05 Sep 2023 | Sell Price: 131.01 | Profit: Open Day1 ($ 130.44) | Abandoned Baby | Sell |
| 012 22 Aug 2023 | Sell Price: 127.77 | Profit: Close Day2 ($ 127.56) | Engulfing | Sell |
| 013 22 Aug 2023 | Sell Price: 127.95 | Profit: Close Day2 ($ 127.56) | Dark Cloud Cover | Sell |
| 014 21 Aug 2023 | Buy Price: 128.28 | Profit: Open Day1 ($ 128.92) | Abandoned Baby | Buy |
| 015 31 May 2023 | Sell Price: 122.48 | Profit: Open Day1 ($ 122.19) | Abandoned Baby | Sell |
| 016One Year Average | Both Sides Result for 15 Signals |
Profit: $ 5.73 ($ 0.38 / Signal) |
All of Them | Buy + Sell |
| Simple Moving Averages (SMA) Period | Value $ | Signal | Exponential Moving Averages (EMA) Period | Value $ | Signal | |
|---|---|---|---|---|---|---|
| 2 | 142.17 | SELL | 2 | 141.92 | SELL | |
| 3 | 142.12 | SELL | 3 | 142.28 | SELL | |
| 5 | 143.21 | SELL | 5 | 142.87 | SELL | |
| 8 | 144.20 | SELL | 8 | 143.38 | SELL | |
| 13 | 144.24 | SELL | 13 | 143.59 | SELL | |
| 21 | 143.70 | SELL | 21 | 143.45 | SELL | |
| 34 | 142.78 | SELL | 34 | 142.95 | SELL | |
| 55 | 142.69 | SELL | 55 | 141.85 | SELL | |
| 90 | 140.52 | BUY | 90 | 139.89 | BUY | |
| 200 | 134.74 | BUY | 200 | 135.72 | BUY |
Te Connectivity Ltd
IPO: 2009-06-26
Ticker: TELIndices: S&P 500,
Exchange: New York Stock Exchange, Inc. (CH - USD)
Website: https://www.te.com/
Phone:
Common Stock
Trade & Services (
Wholesale-electronic Parts & Equipment, Nec
 Click to Enlarge