| Date | Price $ | Result % | Candle Name | Side |
|---|---|---|---|---|
| 001 22 Mar 2024 | Sell Price: 220.94 | Profit: Open Day1 ($ 220.59) | Engulfing | Sell |
| 002 01 Feb 2024 | Buy Price: 247.65 | Loss: Close Day2 ($ 244.10) | Engulfing | Buy |
| 003 16 Jan 2024 | Sell Price: 245.91 | Profit: Open Day1 ($ 243.13) | Abandoned Baby | Sell |
| 004 11 Jan 2024 | Sell Price: 248.34 | Profit: Open Day2 ($ 246.88) | Abandoned Baby | Sell |
| 005 28 Nov 2023 | Buy Price: 219.83 | Profit: Open Day1 ($ 220.78) | Engulfing | Buy |
| 006 10 Oct 2023 | Buy Price: 199.24 | Loss: Close Day2 ($ 187.35) | Engulfing | Buy |
| 007 15 Sep 2023 | Sell Price: 214.13 | Profit: Open Day1 ($ 212.91) | Abandoned Baby | Sell |
| 008 15 Sep 2023 | Sell Price: 213.45 | Profit: Open Day1 ($ 212.91) | Engulfing | Sell |
| 009 27 Jul 2023 | Sell Price: 250.07 | Loss: Close Day2 ($ 251.17) | Dark Cloud Cover | Sell |
| 010 24 Jul 2023 | Sell Price: 257.17 | Profit: Open Day1 ($ 255.92) | Engulfing | Sell |
| 011 14 Jul 2023 | Sell Price: 245.70 | Profit: Open Day1 ($ 244.87) | Abandoned Baby | Sell |
| 012 14 Jul 2023 | Sell Price: 245.86 | Profit: Open Day1 ($ 244.87) | Engulfing | Sell |
| 013 13 Jun 2023 | Buy Price: 239.06 | Profit: Open Day1 ($ 242.78) | Engulfing | Buy |
| 014One Year Average | Both Sides Result for 13 Signals |
Loss: $ -2.45 ($ -0.19 / Signal) |
All of Them | Buy + Sell |
| Simple Moving Averages (SMA) Period | Value $ | Signal | Exponential Moving Averages (EMA) Period | Value $ | Signal | |
|---|---|---|---|---|---|---|
| 2 | 211.14 | BUY | 2 | 210.71 | BUY | |
| 3 | 209.85 | BUY | 3 | 210.23 | BUY | |
| 5 | 208.70 | BUY | 5 | 209.94 | BUY | |
| 8 | 209.07 | BUY | 8 | 210.45 | BUY | |
| 13 | 212.56 | SELL | 13 | 211.87 | SELL | |
| 21 | 214.93 | SELL | 21 | 214.24 | SELL | |
| 34 | 217.53 | SELL | 34 | 217.93 | SELL | |
| 55 | 226.06 | SELL | 55 | 222.15 | SELL | |
| 90 | 234.52 | SELL | 90 | 225.09 | SELL | |
| 200 | 224.54 | SELL | 200 | 228.55 | SELL |
Teleflex Inc
IPO: 1981-05-22
Ticker: TFXIndices: S&P 500,
Exchange: New York Stock Exchange, Inc. (US - USD)
Website: https://www.teleflex.com/
Phone:
Common Stock
Life Sciences (
Surgical & Medical Instruments & Apparatus

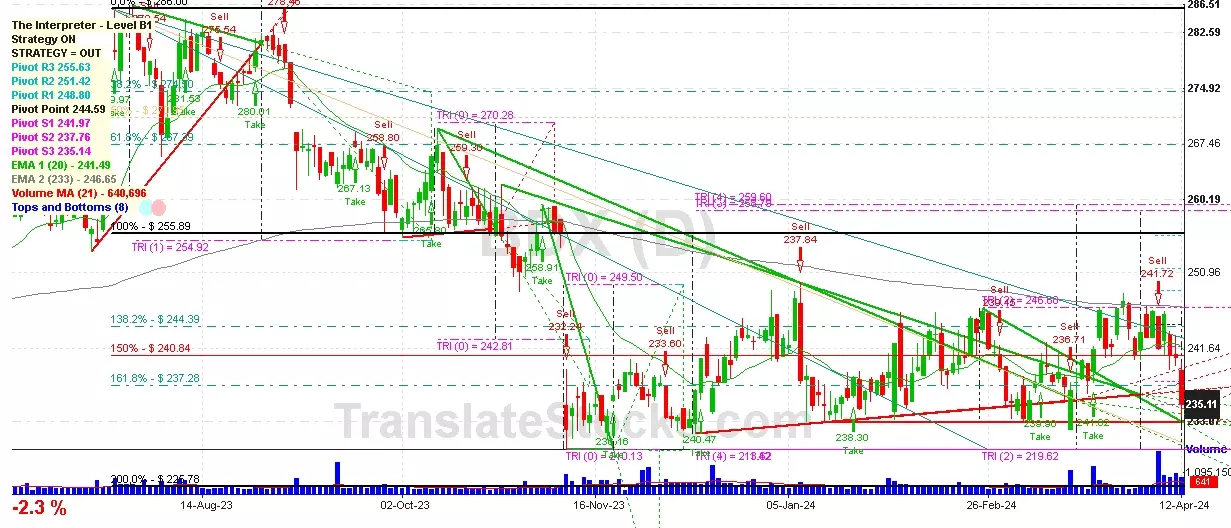
 Click to Enlarge