| Date | Price $ | Result % | Candle Name | Side |
|---|---|---|---|---|
| 001 14 Feb 2024 | Buy Price: 548.27 | Profit: Close Day1 ($ 548.57) | Abandoned Baby | Buy |
| 002 15 Dec 2023 | Sell Price: 518.03 | Loss: Close Day2 ($ 528.14) | Abandoned Baby | Sell |
| 003 11 Oct 2023 | Sell Price: 492.63 | Profit: Open Day1 ($ 491.84) | Engulfing | Sell |
| 004 03 Oct 2023 | Buy Price: 499.61 | Profit: Open Day1 ($ 501.21) | Piercing Line | Buy |
| 005 14 Sep 2023 | Buy Price: 515.64 | Loss: Close Day2 ($ 507.73) | Abandoned Baby | Buy |
| 006 31 Aug 2023 | Sell Price: 557.10 | Profit: Close Day2 ($ 542.01) | Engulfing | Sell |
| 007 02 Aug 2023 | Buy Price: 553.76 | Loss: Close Day2 ($ 548.64) | Engulfing | Buy |
| 008 20 Jun 2023 | Sell Price: 527.40 | Profit: Open Day1 ($ 524.99) | Abandoned Baby | Sell |
| 009 14 Jun 2023 | Sell Price: 519.42 | Loss: Close Day2 ($ 537.30) | Abandoned Baby | Sell |
| 010 14 Jun 2023 | Sell Price: 520.12 | Loss: Close Day2 ($ 537.30) | Engulfing | Sell |
| 011 23 May 2023 | Sell Price: 525.10 | Profit: Open Day1 ($ 510.00) | Abandoned Baby | Sell |
| 012 17 May 2023 | Buy Price: 521.67 | Profit: Close Day1 ($ 523.54) | Abandoned Baby | Buy |
| 013One Year Average | Both Sides Result for 12 Signals |
Loss: $ -21.04 ($ -1.75 / Signal) |
All of Them | Buy + Sell |
| Simple Moving Averages (SMA) Period | Value $ | Signal | Exponential Moving Averages (EMA) Period | Value $ | Signal | |
|---|---|---|---|---|---|---|
| 2 | 561.49 | BUY | 2 | 565.44 | BUY | |
| 3 | 555.92 | BUY | 3 | 560.92 | BUY | |
| 5 | 551.30 | BUY | 5 | 557.83 | BUY | |
| 8 | 554.27 | BUY | 8 | 558.32 | BUY | |
| 13 | 563.84 | BUY | 13 | 561.42 | BUY | |
| 21 | 568.02 | BUY | 21 | 565.27 | BUY | |
| 34 | 576.01 | SELL | 34 | 567.06 | BUY | |
| 55 | 569.47 | BUY | 55 | 563.75 | BUY | |
| 90 | 557.33 | BUY | 90 | 554.97 | BUY | |
| 200 | 529.25 | BUY | 200 | 541.62 | BUY |
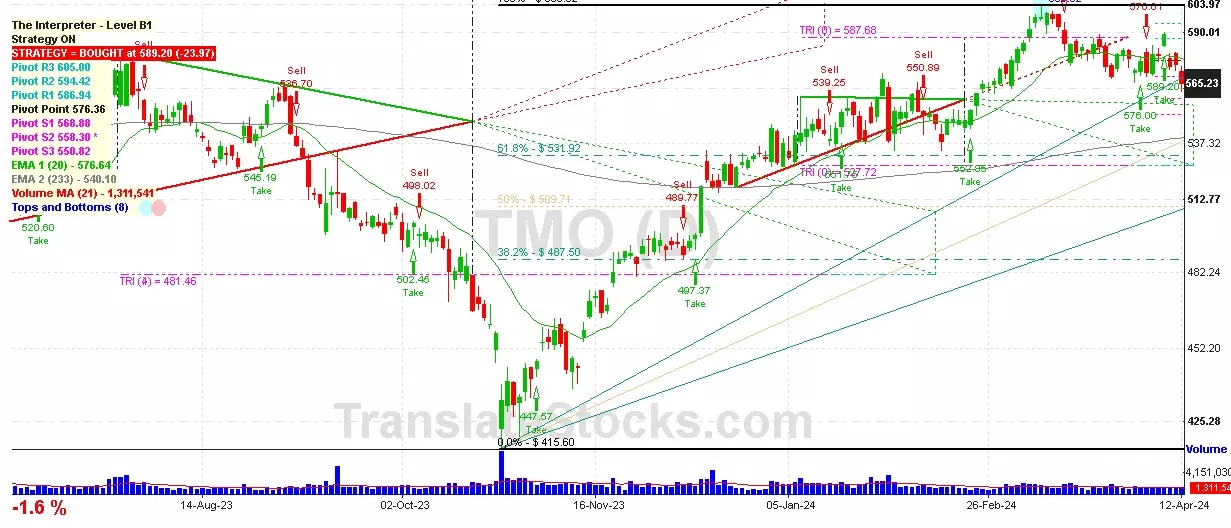
Thermo Fisher Scientific Inc
IPO: 1980-08-27
Ticker: TMOIndices: S&P 500,
Exchange: New York Stock Exchange, Inc. (US - USD)
Website: https://www.thermofisher.com/
Phone:
Common Stock
Life Sciences (
Measuring & Controlling Devices, Nec

 Click to Enlarge