
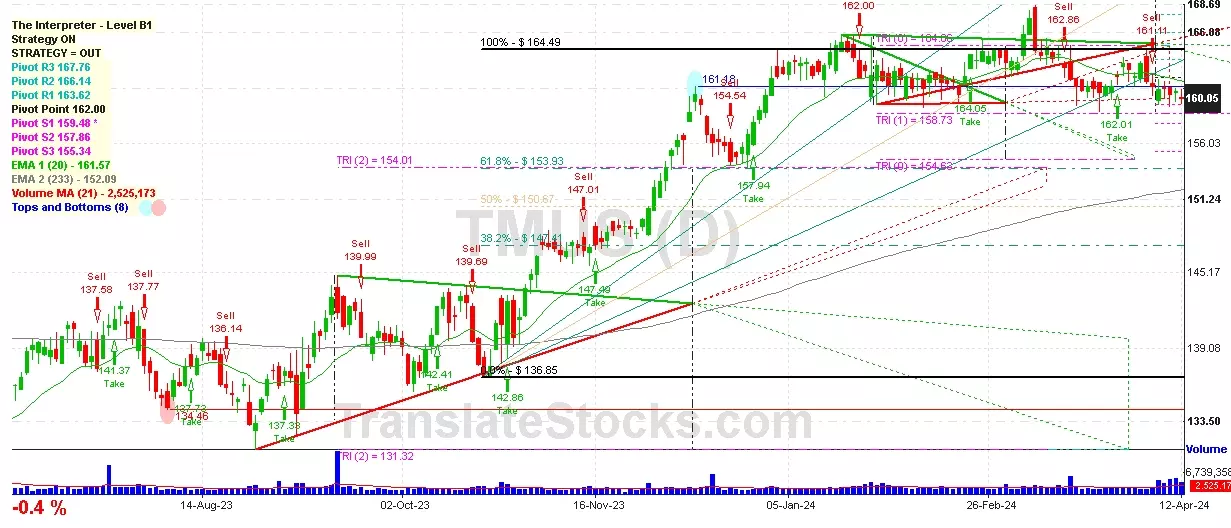
Hey Friend, I'm analysing T MOBILE US INC (TMUS), and it is between the Support of $ 159.48 (PivotS1) and the Resistance of $ 162.00 (Pivot). The stock is also approaching the line of PivotS1 at $ 159.48, and if it goes below this line it could reach the next Support of Triangle projection at $158.73.

| Date | Price $ | Result % | Candle Name | Side |
|---|---|---|---|---|
| 001 25 Mar 2024 | Buy Price: 161.12 | Profit: Open Day2 ($ 162.23) | Piercing Line | Buy |
| 002 20 Feb 2024 | Buy Price: 162.05 | Profit: Open Day1 ($ 162.81) | Abandoned Baby | Buy |
| 003 09 Nov 2023 | Buy Price: 146.97 | Profit: Open Day1 ($ 147.35) | Engulfing | Buy |
| 004 09 Nov 2023 | Buy Price: 146.89 | Profit: Open Day1 ($ 147.35) | Piercing Line | Buy |
| 005 28 Jul 2023 | Buy Price: 140.87 | Loss: Close Day2 ($ 137.26) | Piercing Line | Buy |
| 006 19 Jul 2023 | Sell Price: 137.58 | Loss: Close Day2 ($ 140.90) | Engulfing | Sell |
| 007 13 Jul 2023 | Sell Price: 140.69 | Profit: Open Day1 ($ 138.97) | Engulfing | Sell |
| 008 12 Jun 2023 | Sell Price: 130.78 | Profit: Open Day1 ($ 130.70) | Dark Cloud Cover | Sell |
| 009 31 May 2023 | Buy Price: 137.25 | Profit: Open Day1 ($ 137.36) | Abandoned Baby | Buy |
| 010One Year Average | Both Sides Result for 9 Signals |
Loss: $ -2.31 ($ -0.26 / Signal) |
All of Them | Buy + Sell |
| Simple Moving Averages (SMA) Period | Value $ | Signal | Exponential Moving Averages (EMA) Period | Value $ | Signal | |
|---|---|---|---|---|---|---|
| 2 | 160.47 | BUY | 2 | 160.57 | BUY | |
| 3 | 160.24 | BUY | 3 | 160.43 | BUY | |
| 5 | 160.12 | BUY | 5 | 160.38 | BUY | |
| 8 | 160.33 | BUY | 8 | 160.49 | BUY | |
| 13 | 160.89 | SELL | 13 | 160.77 | BUY | |
| 21 | 161.16 | SELL | 21 | 161.15 | SELL | |
| 34 | 162.12 | SELL | 34 | 161.48 | SELL | |
| 55 | 162.21 | SELL | 55 | 161.17 | SELL | |
| 90 | 161.58 | SELL | 90 | 159.40 | BUY | |
| 200 | 150.46 | BUY | 200 | 153.66 | BUY |
T-mobile Us Inc
IPO: 2007-04-18
Ticker: TMUSIndices: S&P 500,
Nasdaq 100,
Exchange: Nasdaq Nms - Global Market (US - USD)
Website: https://www.t-mobile.com/
Phone:
Common Stock
Technology (
Radiotelephone Communications
 Click to Enlarge