| Date | Price $ | Result % | Candle Name | Side |
|---|---|---|---|---|
| 001 01 Feb 2024 | Buy Price: 166.33 | Profit: Open Day1 ($ 166.53) | Engulfing | Buy |
| 002 04 Jan 2024 | Buy Price: 158.86 | Loss: Close Day2 ($ 158.54) | Piercing Line | Buy |
| 003 29 Dec 2023 | Sell Price: 160.95 | Profit: Open Day1 ($ 160.14) | Engulfing | Sell |
| 004 29 Dec 2023 | Sell Price: 160.92 | Profit: Open Day1 ($ 160.14) | Dark Cloud Cover | Sell |
| 005 21 Dec 2023 | Buy Price: 160.39 | Profit: Close Day1 ($ 161.95) | Abandoned Baby | Buy |
| 006 04 Oct 2023 | Buy Price: 139.63 | Profit: Close Day1 ($ 140.20) | Abandoned Baby | Buy |
| 007 20 Sep 2023 | Sell Price: 140.72 | Profit: Open Day1 ($ 139.00) | Engulfing | Sell |
| 008 07 Sep 2023 | Buy Price: 142.23 | Profit: Open Day1 ($ 142.75) | Engulfing | Buy |
| 009 02 Jun 2023 | Sell Price: 137.52 | Profit: Open Day1 ($ 136.85) | Dark Cloud Cover | Sell |
| 010 19 May 2023 | Sell Price: 137.43 | Profit: Close Day1 ($ 137.25) | Engulfing | Sell |
| 011 19 May 2023 | Sell Price: 137.57 | Profit: Open Day1 ($ 137.43) | Dark Cloud Cover | Sell |
| 012 12 May 2023 | Sell Price: 125.26 | Profit: Close Day1 ($ 125.07) | Dark Cloud Cover | Sell |
| 013One Year Average | Both Sides Result for 12 Signals |
Profit: $ 7.01 ($ 0.58 / Signal) |
All of Them | Buy + Sell |
| Simple Moving Averages (SMA) Period | Value $ | Signal | Exponential Moving Averages (EMA) Period | Value $ | Signal | |
|---|---|---|---|---|---|---|
| 2 | 140.62 | SELL | 2 | 140.99 | SELL | |
| 3 | 141.47 | SELL | 3 | 141.66 | SELL | |
| 5 | 143.03 | SELL | 5 | 143.07 | SELL | |
| 8 | 145.74 | SELL | 8 | 144.69 | SELL | |
| 13 | 148.20 | SELL | 13 | 146.15 | SELL | |
| 21 | 148.52 | SELL | 21 | 147.22 | SELL | |
| 34 | 147.15 | SELL | 34 | 148.44 | SELL | |
| 55 | 150.64 | SELL | 55 | 149.96 | SELL | |
| 90 | 154.85 | SELL | 90 | 150.75 | SELL | |
| 200 | 149.36 | SELL | 200 | 147.35 | SELL |
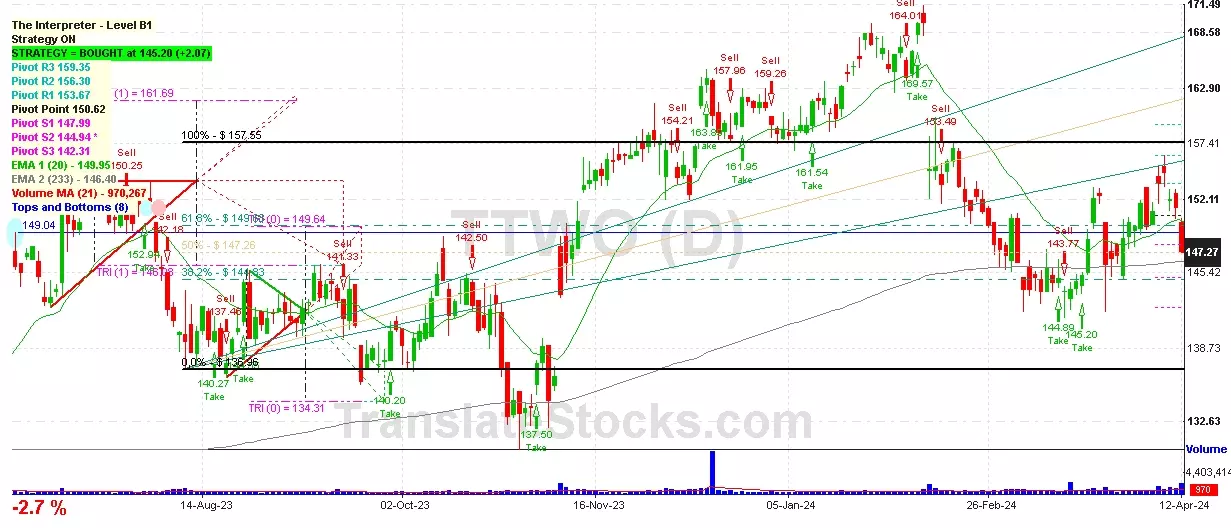
Take-two Interactive Softwre
IPO: 1997-04-15
Ticker: TTWOIndices: S&P 500,
Exchange: Nasdaq Nms - Global Market (US - USD)
Website: http://www.take2games.com
Phone:
Common Stock
Technology (
Services-prepackaged Software

 Click to Enlarge