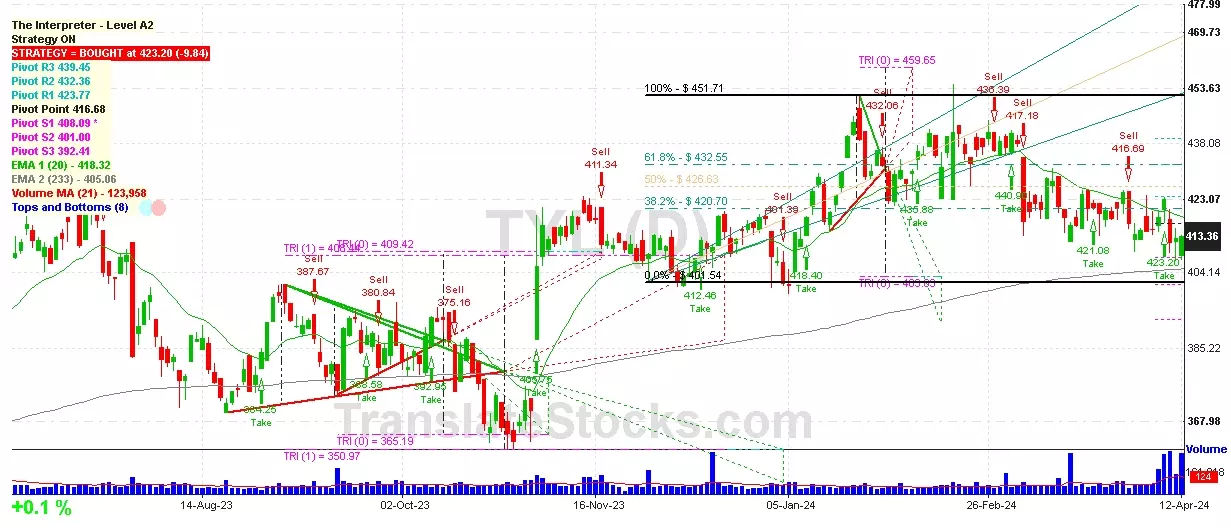
Hey Friend, I'm analysing TYLER TECHNOLOGIES INC (TYL), and it is between the Support of $ 409.42 (Triangle Projection Level 0) and the Resistance of $ 416.68 (Pivot). The stock is also approaching the line of Pivot at $ 416.68, and if it goes above this line it could reach the next Resistance of 38.2% of Fibonacci at $ 420.70.

| Date | Price $ | Result % | Candle Name | Side |
|---|---|---|---|---|
| 001 18 Mar 2024 | Buy Price: 416.33 | Profit: Close Day1 ($ 424.40) | Abandoned Baby | Buy |
| 002 11 Mar 2024 | Buy Price: 428.82 | Profit: Open Day2 ($ 429.35) | Engulfing | Buy |
| 003 01 Mar 2024 | Buy Price: 440.90 | Loss: Close Day2 ($ 417.18) | Engulfing | Buy |
| 004 01 Mar 2024 | Buy Price: 441.58 | Loss: Close Day2 ($ 417.18) | Piercing Line | Buy |
| 005 27 Feb 2024 | Sell Price: 436.39 | Profit: Open Day1 ($ 434.88) | Engulfing | Sell |
| 006 24 Jan 2024 | Sell Price: 439.29 | Profit: Close Day1 ($ 429.25) | Engulfing | Sell |
| 007 24 Jan 2024 | Sell Price: 440.02 | Profit: Close Day1 ($ 429.25) | Dark Cloud Cover | Sell |
| 008 08 Jan 2024 | Buy Price: 414.42 | Profit: Close Day2 ($ 418.40) | Abandoned Baby | Buy |
| 009 27 Dec 2023 | Sell Price: 415.60 | Profit: Open Day1 ($ 415.10) | Dark Cloud Cover | Sell |
| 010 08 Dec 2023 | Buy Price: 403.07 | Profit: Close Day1 ($ 403.91) | Piercing Line | Buy |
| 011 27 Nov 2023 | Buy Price: 411.27 | Profit: Open Day2 ($ 412.44) | Piercing Line | Buy |
| 012 09 Nov 2023 | Sell Price: 413.28 | Loss: Close Day2 ($ 416.38) | Engulfing | Sell |
| 013 24 Oct 2023 | Buy Price: 374.16 | Loss: Close Day2 ($ 365.28) | Abandoned Baby | Buy |
| 014 29 Sep 2023 | Sell Price: 386.14 | Profit: Close Day1 ($ 382.36) | Dark Cloud Cover | Sell |
| 015 11 Sep 2023 | Sell Price: 387.67 | Profit: Open Day1 ($ 384.35) | Engulfing | Sell |
| 016 24 Aug 2023 | Sell Price: 375.12 | Loss: Close Day2 ($ 384.25) | Engulfing | Sell |
| 017 24 Aug 2023 | Sell Price: 375.83 | Loss: Close Day2 ($ 384.25) | Dark Cloud Cover | Sell |
| 018 02 Aug 2023 | Sell Price: 388.13 | Profit: Open Day1 ($ 385.53) | Abandoned Baby | Sell |
| 019 27 Jul 2023 | Sell Price: 383.39 | Loss: Close Day2 ($ 396.63) | Engulfing | Sell |
| 020 25 Jul 2023 | Buy Price: 408.08 | Profit: Close Day1 ($ 408.42) | Abandoned Baby | Buy |
| 021 14 Jul 2023 | Sell Price: 410.98 | Loss: Close Day2 ($ 422.13) | Abandoned Baby | Sell |
| 022One Year Average | Both Sides Result for 21 Signals |
Loss: $ -54.59 ($ -2.60 / Signal) |
All of Them | Buy + Sell |
| Simple Moving Averages (SMA) Period | Value $ | Signal | Exponential Moving Averages (EMA) Period | Value $ | Signal | |
|---|---|---|---|---|---|---|
| 2 | 414.93 | BUY | 2 | 415.18 | BUY | |
| 3 | 411.07 | BUY | 3 | 412.87 | BUY | |
| 5 | 407.80 | BUY | 5 | 410.50 | BUY | |
| 8 | 406.53 | BUY | 8 | 409.71 | BUY | |
| 13 | 410.27 | BUY | 13 | 410.52 | BUY | |
| 21 | 413.23 | BUY | 21 | 412.75 | BUY | |
| 34 | 416.44 | BUY | 34 | 415.84 | BUY | |
| 55 | 423.67 | SELL | 55 | 418.05 | BUY | |
| 90 | 422.57 | SELL | 90 | 417.23 | BUY | |
| 200 | 406.71 | BUY | 200 | 407.11 | BUY |
Tyler Technologies Inc
IPO: 1980-03-17
Ticker: TYLIndices: S&P 500,
Exchange: New York Stock Exchange, Inc. (US - USD)
Website: https://www.tylertech.com/
Phone:
Common Stock
Technology (
Services-prepackaged Software
 Click to Enlarge