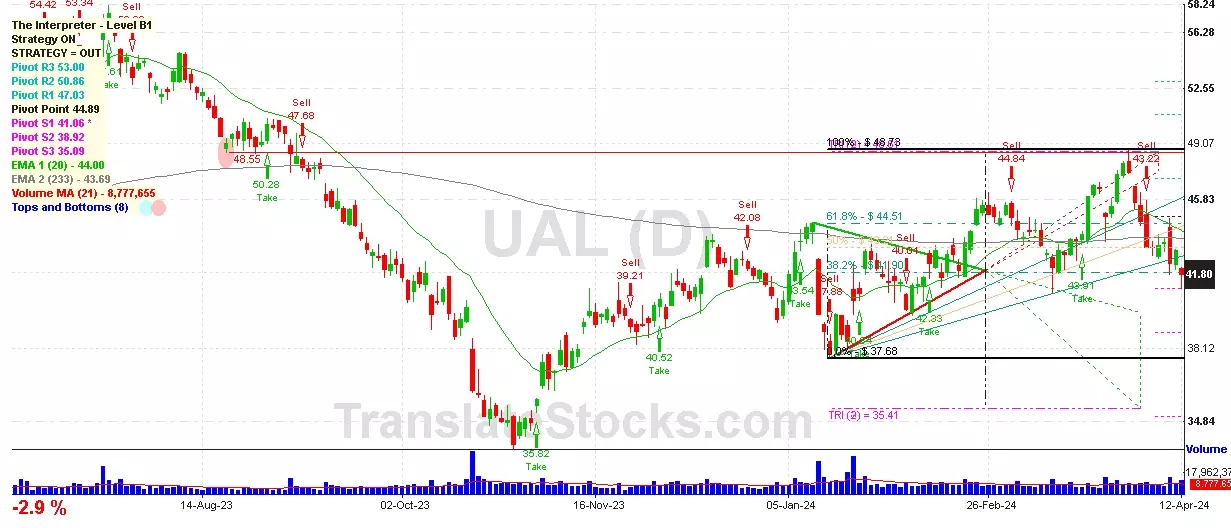
Hey Friend, I'm analysing UNITED AIRLINES HOLDINGS INC (UAL), and it is between the Support of $ 41.06 (PivotS1) and the Resistance of $ 41.90 (38.2% of Fibonacci). The stock is also approaching the line of PivotS1 at $ 41.06, and if it goes below this line it could reach the next Support of 0% of Fibonacci at $ 37.68.

| Date | Price $ | Result % | Candle Name | Side |
|---|---|---|---|---|
| 001 08 Apr 2024 | Buy Price: 43.31 | Profit: Open Day1 ($ 43.43) | Engulfing | Buy |
| 002 13 Mar 2024 | Buy Price: 43.04 | Profit: Close Day2 ($ 43.62) | Engulfing | Buy |
| 003 20 Feb 2024 | Buy Price: 43.46 | Profit: Close Day1 ($ 44.05) | Engulfing | Buy |
| 004 02 Feb 2024 | Sell Price: 41.37 | Profit: Open Day1 ($ 40.76) | Abandoned Baby | Sell |
| 005 28 Dec 2023 | Buy Price: 41.97 | Loss: Close Day2 ($ 40.72) | Piercing Line | Buy |
| 006 06 Nov 2023 | Sell Price: 36.76 | Loss: Close Day2 ($ 38.04) | Dark Cloud Cover | Sell |
| 007 27 Oct 2023 | Sell Price: 33.90 | Loss: Close Day2 ($ 35.01) | Engulfing | Sell |
| 008 29 Jun 2023 | Sell Price: 53.72 | Loss: Close Day2 ($ 55.06) | Engulfing | Sell |
| 009 02 Jun 2023 | Buy Price: 48.50 | Profit: Close Day2 ($ 48.79) | Abandoned Baby | Buy |
| 010One Year Average | Both Sides Result for 9 Signals |
Loss: $ -2.79 ($ -0.31 / Signal) |
All of Them | Buy + Sell |
| Simple Moving Averages (SMA) Period | Value $ | Signal | Exponential Moving Averages (EMA) Period | Value $ | Signal | |
|---|---|---|---|---|---|---|
| 2 | 41.42 | SELL | 2 | 41.42 | SELL | |
| 3 | 41.96 | SELL | 3 | 41.72 | SELL | |
| 5 | 42.34 | SELL | 5 | 42.19 | SELL | |
| 8 | 42.68 | SELL | 8 | 42.75 | SELL | |
| 13 | 44.17 | SELL | 13 | 43.35 | SELL | |
| 21 | 44.51 | SELL | 21 | 43.74 | SELL | |
| 34 | 44.26 | SELL | 34 | 43.78 | SELL | |
| 55 | 43.59 | SELL | 55 | 43.49 | SELL | |
| 90 | 42.72 | SELL | 90 | 43.18 | SELL | |
| 200 | 44.32 | SELL | 200 | 43.54 | SELL |
United Airlines Holdings Inc
IPO: 2010-10-01
Ticker: UALIndices: S&P 500,
Exchange: Nasdaq Nms - Global Market (US - USD)
Website: https://ir.united.com/
Phone:
Common Stock
Energy & Transportation (
Air Transportation, Scheduled
 Click to Enlarge