| Date | Price $ | Result % | Candle Name | Side |
|---|---|---|---|---|
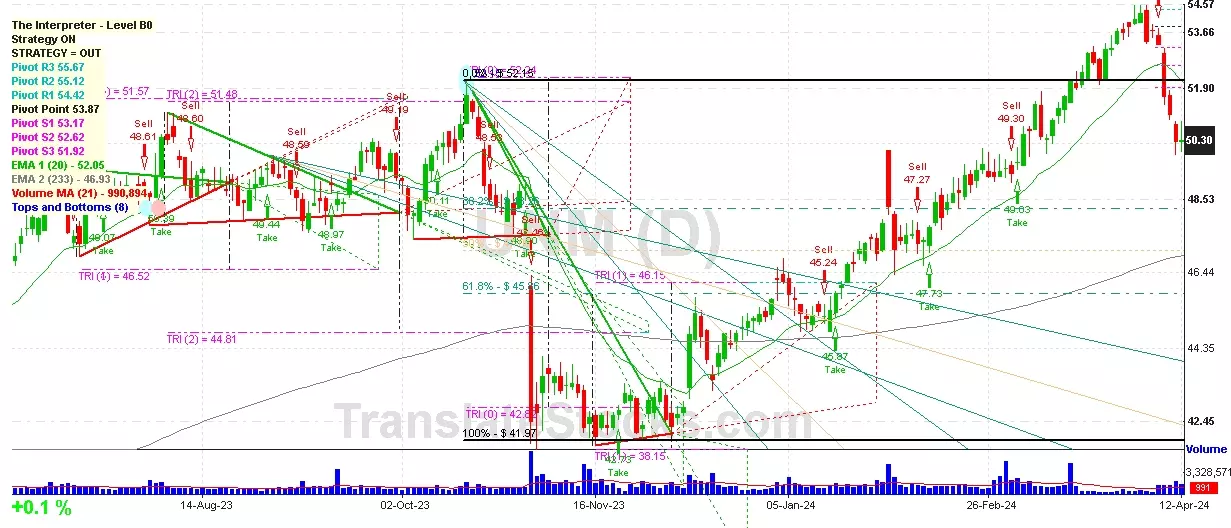
| 001 15 Apr 2024 | Sell Price: 49.95 | Loss: Close Day2 ($ 50.16) | Engulfing | Sell |
| 002 26 Feb 2024 | Sell Price: 49.20 | Loss: Close Day2 ($ 49.36) | Abandoned Baby | Sell |
| 003 07 Feb 2024 | Sell Price: 47.27 | Profit: Open Day2 ($ 47.22) | Engulfing | Sell |
| 004 16 Jan 2024 | Sell Price: 45.24 | Profit: Open Day1 ($ 44.83) | Abandoned Baby | Sell |
| 005 29 Dec 2023 | Sell Price: 45.22 | Loss: Close Day2 ($ 46.25) | Dark Cloud Cover | Sell |
| 006 01 Nov 2023 | Sell Price: 42.46 | Loss: Close Day2 ($ 43.62) | Abandoned Baby | Sell |
| 007 12 Oct 2023 | Sell Price: 50.11 | Profit: Close Day1 ($ 49.94) | Engulfing | Sell |
| 008 08 Sep 2023 | Buy Price: 48.14 | Profit: Open Day1 ($ 48.36) | Piercing Line | Buy |
| 009 30 Aug 2023 | Sell Price: 49.29 | Profit: Open Day1 ($ 49.27) | Engulfing | Sell |
| 010 30 Aug 2023 | Sell Price: 49.28 | Profit: Open Day1 ($ 49.27) | Dark Cloud Cover | Sell |
| 011 18 Aug 2023 | Sell Price: 48.79 | Profit: Close Day2 ($ 48.37) | Abandoned Baby | Sell |
| 012 17 Aug 2023 | Buy Price: 49.09 | Profit: Open Day2 ($ 49.11) | Abandoned Baby | Buy |
| 013 17 Jul 2023 | Buy Price: 48.49 | Profit: Open Day1 ($ 48.55) | Engulfing | Buy |
| 014 27 Apr 2023 | Buy Price: 41.27 | Profit: Close Day1 ($ 42.20) | Engulfing | Buy |
| 015One Year Average | Both Sides Result for 14 Signals |
Loss: $ -0.25 ($ -0.02 / Signal) |
All of Them | Buy + Sell |
| Simple Moving Averages (SMA) Period | Value $ | Signal | Exponential Moving Averages (EMA) Period | Value $ | Signal | |
|---|---|---|---|---|---|---|
| 2 | 51.88 | BUY | 2 | 51.89 | BUY | |
| 3 | 51.85 | BUY | 3 | 51.78 | BUY | |
| 5 | 51.54 | BUY | 5 | 51.57 | BUY | |
| 8 | 51.03 | BUY | 8 | 51.45 | BUY | |
| 13 | 51.13 | BUY | 13 | 51.51 | BUY | |
| 21 | 52.12 | SELL | 21 | 51.58 | BUY | |
| 34 | 52.00 | SELL | 34 | 51.35 | BUY | |
| 55 | 50.81 | BUY | 55 | 50.66 | BUY | |
| 90 | 48.89 | BUY | 90 | 49.66 | BUY | |
| 200 | 48.08 | BUY | 200 | 47.74 | BUY |
Unum Group
IPO: 1986-11-06
Ticker: UNMIndices: S&P 500,
Exchange: New York Stock Exchange, Inc. (US - USD)
Website: https://www.unum.com/
Phone:
Common Stock
Finance (
Accident & Health Insurance

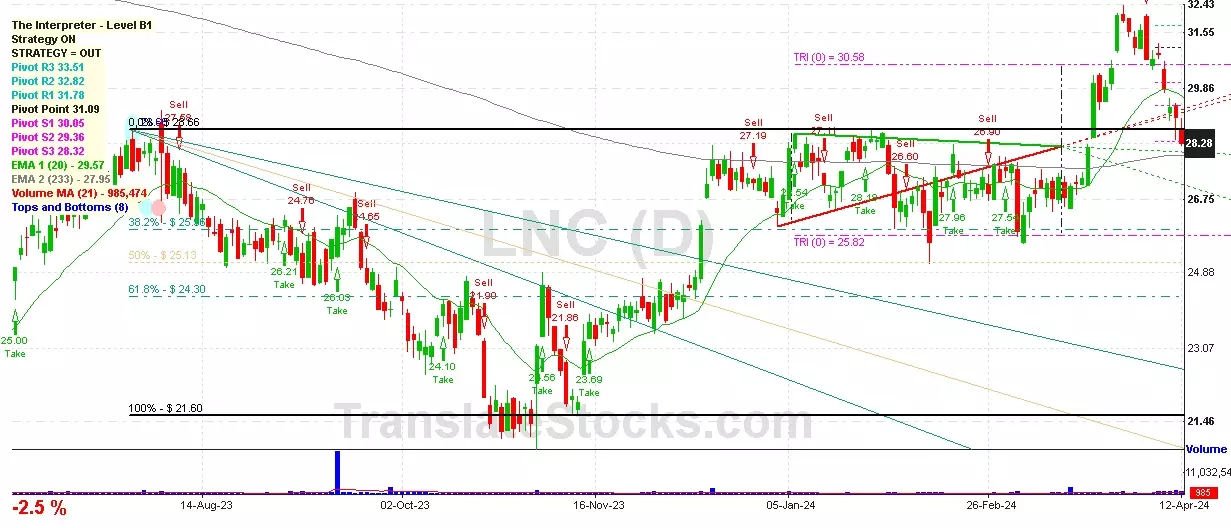
 Click to Enlarge