| Date | Price $ | Result % | Candle Name | Side |
|---|---|---|---|---|
| 001 09 Jan 2024 | Buy Price: 234.72 | Profit: Open Day1 ($ 235.30) | Engulfing | Buy |
| 002 21 Dec 2023 | Buy Price: 235.01 | Profit: Open Day1 ($ 235.86) | Engulfing | Buy |
| 003 19 Dec 2023 | Sell Price: 234.46 | Profit: Open Day1 ($ 233.77) | Engulfing | Sell |
| 004 20 Nov 2023 | Buy Price: 239.28 | Profit: Open Day1 ($ 239.90) | Engulfing | Buy |
| 005 14 Nov 2023 | Sell Price: 237.98 | Profit: Close Day1 ($ 237.79) | Engulfing | Sell |
| 006 14 Nov 2023 | Sell Price: 238.06 | Profit: Close Day1 ($ 237.79) | Dark Cloud Cover | Sell |
| 007 05 Sep 2023 | Sell Price: 240.61 | Loss: Close Day2 ($ 245.16) | Abandoned Baby | Sell |
| 008 14 Jun 2023 | Buy Price: 220.28 | Profit: Close Day1 ($ 224.57) | Engulfing | Buy |
| 009 12 May 2023 | Sell Price: 215.01 | Profit: Open Day1 ($ 214.99) | Dark Cloud Cover | Sell |
| 010 27 Apr 2023 | Buy Price: 192.10 | Profit: Open Day1 ($ 193.00) | Abandoned Baby | Buy |
| 011One Year Average | Both Sides Result for 10 Signals |
Profit: $ 3.86 ($ 0.39 / Signal) |
All of Them | Buy + Sell |
| Simple Moving Averages (SMA) Period | Value $ | Signal | Exponential Moving Averages (EMA) Period | Value $ | Signal | |
|---|---|---|---|---|---|---|
| 2 | 222.93 | SELL | 2 | 222.67 | SELL | |
| 3 | 222.70 | SELL | 3 | 222.69 | SELL | |
| 5 | 222.48 | BUY | 5 | 222.93 | SELL | |
| 8 | 223.02 | SELL | 8 | 223.68 | SELL | |
| 13 | 225.01 | SELL | 13 | 225.22 | SELL | |
| 21 | 228.26 | SELL | 21 | 227.54 | SELL | |
| 34 | 231.42 | SELL | 34 | 230.41 | SELL | |
| 55 | 236.73 | SELL | 55 | 233.12 | SELL | |
| 90 | 237.45 | SELL | 90 | 234.78 | SELL | |
| 200 | 236.78 | SELL | 200 | 231.10 | SELL |
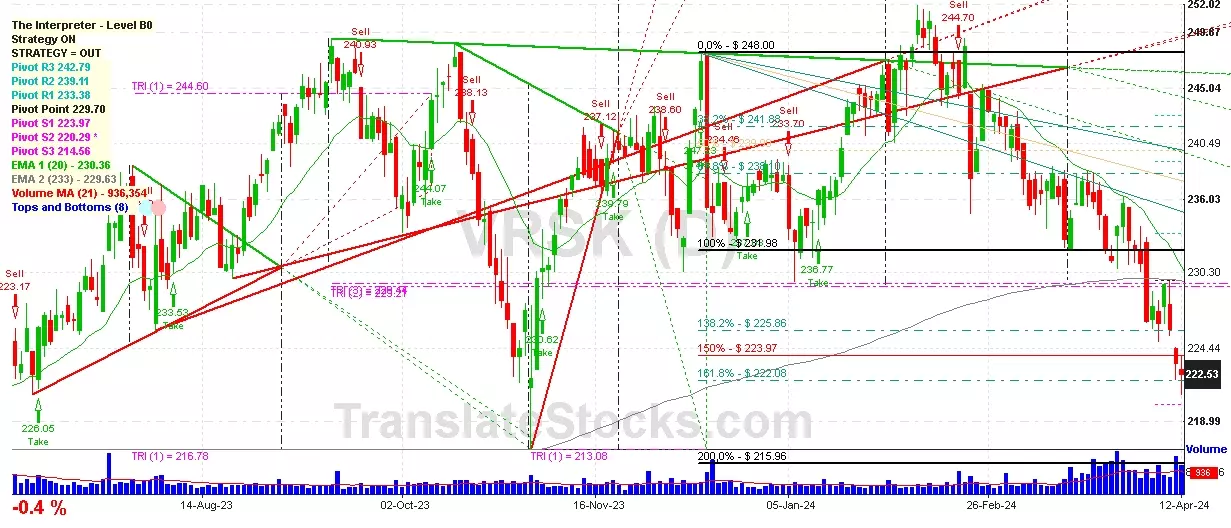
Verisk Analytics Inc
IPO: 2009-10-09
Ticker: VRSKIndices: S&P 500,
Nasdaq 100,
Exchange: Nasdaq Nms - Global Market (US - USD)
Website: https://www.verisk.com
Phone:
Common Stock
Technology (
Services-computer Processing & Data Preparation

 Click to Enlarge