| Date | Price $ | Result % | Candle Name | Side |
|---|---|---|---|---|
| 001 01 Apr 2024 | Sell Price: 189.34 | Profit: Close Day2 ($ 188.97) | Abandoned Baby | Sell |
| 002 27 Mar 2024 | Buy Price: 189.10 | Profit: Open Day1 ($ 189.49) | Abandoned Baby | Buy |
| 003 16 Jan 2024 | Sell Price: 202.44 | Profit: Open Day1 ($ 201.49) | Abandoned Baby | Sell |
| 004 24 Nov 2023 | Sell Price: 213.23 | Loss: Close Day2 ($ 213.49) | Engulfing | Sell |
| 005 24 Nov 2023 | Sell Price: 213.23 | Loss: Close Day2 ($ 213.49) | Dark Cloud Cover | Sell |
| 006 19 Sep 2023 | Buy Price: 200.40 | Profit: Open Day1 ($ 201.52) | Engulfing | Buy |
| 007 07 Sep 2023 | Buy Price: 207.75 | Loss: Close Day2 ($ 202.26) | Engulfing | Buy |
| 008 11 Aug 2023 | Buy Price: 205.96 | Profit: Open Day1 ($ 206.45) | Engulfing | Buy |
| 009 10 Aug 2023 | Sell Price: 203.56 | Loss: Close Day2 ($ 208.26) | Engulfing | Sell |
| 010 10 Aug 2023 | Sell Price: 203.97 | Profit: Open Day1 ($ 203.66) | Dark Cloud Cover | Sell |
| 011 31 Jul 2023 | Buy Price: 210.95 | Profit: Close Day1 ($ 211.40) | Engulfing | Buy |
| 012 09 Jun 2023 | Buy Price: 221.02 | Profit: Open Day1 ($ 221.56) | Abandoned Baby | Buy |
| 013 09 Jun 2023 | Buy Price: 220.97 | Profit: Open Day1 ($ 221.56) | Engulfing | Buy |
| 014 02 Jun 2023 | Buy Price: 226.97 | Loss: Close Day2 ($ 224.36) | Engulfing | Buy |
| 015 30 May 2023 | Sell Price: 224.85 | Profit: Open Day1 ($ 224.81) | Dark Cloud Cover | Sell |
| 016 25 May 2023 | Buy Price: 223.85 | Profit: Open Day1 ($ 224.31) | Abandoned Baby | Buy |
| 017 27 Apr 2023 | Buy Price: 216.97 | Profit: Close Day1 ($ 221.80) | Abandoned Baby | Buy |
| 018 27 Apr 2023 | Buy Price: 216.90 | Profit: Close Day1 ($ 221.80) | Engulfing | Buy |
| 019 21 Apr 2023 | Buy Price: 217.56 | Profit: Open Day1 ($ 217.68) | Abandoned Baby | Buy |
| 020One Year Average | Both Sides Result for 19 Signals |
Profit: $ 2.24 ($ 0.12 / Signal) |
All of Them | Buy + Sell |
| Simple Moving Averages (SMA) Period | Value $ | Signal | Exponential Moving Averages (EMA) Period | Value $ | Signal | |
|---|---|---|---|---|---|---|
| 2 | 182.27 | BUY | 2 | 182.68 | BUY | |
| 3 | 182.39 | BUY | 3 | 182.86 | BUY | |
| 5 | 183.16 | SELL | 5 | 183.57 | SELL | |
| 8 | 185.45 | SELL | 8 | 184.58 | SELL | |
| 13 | 186.61 | SELL | 13 | 185.79 | SELL | |
| 21 | 187.51 | SELL | 21 | 187.18 | SELL | |
| 34 | 189.14 | SELL | 34 | 189.08 | SELL | |
| 55 | 191.93 | SELL | 55 | 191.76 | SELL | |
| 90 | 197.05 | SELL | 90 | 195.16 | SELL | |
| 200 | 202.89 | SELL | 200 | 200.42 | SELL |
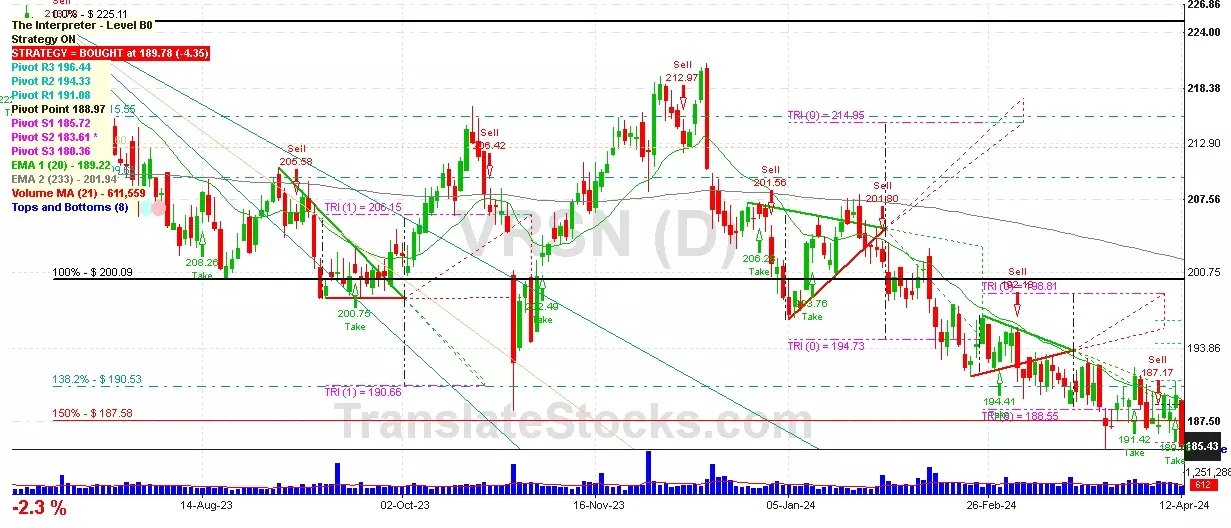
Verisign Inc
IPO: 1998-01-29
Ticker: VRSNIndices: S&P 500,
Nasdaq 100,
Exchange: Nasdaq Nms - Global Market (US - USD)
Website: https://www.verisign.com/
Phone:
Common Stock
Technology (
Services-computer Programming Services

 Click to Enlarge