| Date | Price $ | Result % | Candle Name | Side |
|---|---|---|---|---|
| 001 17 Nov 2023 | Sell Price: 44.54 | Profit: Close Day2 ($ 44.52) | Engulfing | Sell |
| 002 17 Nov 2023 | Sell Price: 44.58 | Profit: Close Day2 ($ 44.52) | Dark Cloud Cover | Sell |
| 003 27 Oct 2023 | Sell Price: 41.62 | Profit: Close Day1 ($ 41.55) | Engulfing | Sell |
| 004 27 Oct 2023 | Sell Price: 41.65 | Profit: Close Day1 ($ 41.55) | Dark Cloud Cover | Sell |
| 005 17 Oct 2023 | Buy Price: 43.63 | Loss: Close Day2 ($ 41.83) | Piercing Line | Buy |
| 006 26 May 2023 | Buy Price: 42.88 | Profit: Open Day1 ($ 43.00) | Abandoned Baby | Buy |
| 007One Year Average | Both Sides Result for 6 Signals |
Loss: $ -1.44 ($ -0.24 / Signal) |
All of Them | Buy + Sell |
| Simple Moving Averages (SMA) Period | Value $ | Signal | Exponential Moving Averages (EMA) Period | Value $ | Signal | |
|---|---|---|---|---|---|---|
| 2 | 42.54 | SELL | 2 | 42.46 | SELL | |
| 3 | 42.75 | SELL | 3 | 42.60 | SELL | |
| 5 | 42.93 | SELL | 5 | 42.76 | SELL | |
| 8 | 42.99 | SELL | 8 | 42.88 | SELL | |
| 13 | 43.07 | SELL | 13 | 42.98 | SELL | |
| 21 | 43.07 | SELL | 21 | 43.13 | SELL | |
| 34 | 43.19 | SELL | 34 | 43.46 | SELL | |
| 55 | 43.98 | SELL | 55 | 43.99 | SELL | |
| 90 | 45.78 | SELL | 90 | 44.48 | SELL | |
| 200 | 44.99 | SELL | 200 | 45.06 | SELL |
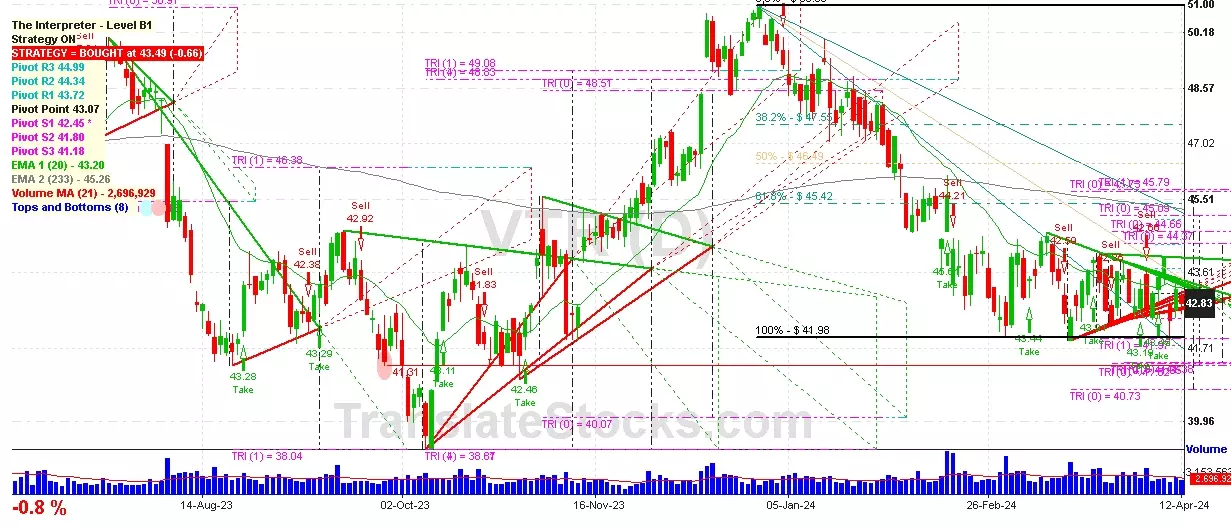
Ventas Inc
IPO: 1992-04-02
Ticker: VTRIndices: S&P 500,
Exchange: New York Stock Exchange, Inc. (US - USD)
Website: https://www.ventasreit.com/
Phone:
REIT (Real Estate Investment Trust)
Real Estate & Construction (
Real Estate Investment Trusts

 Click to Enlarge