| Date | Price $ | Result % | Candle Name | Side |
|---|---|---|---|---|
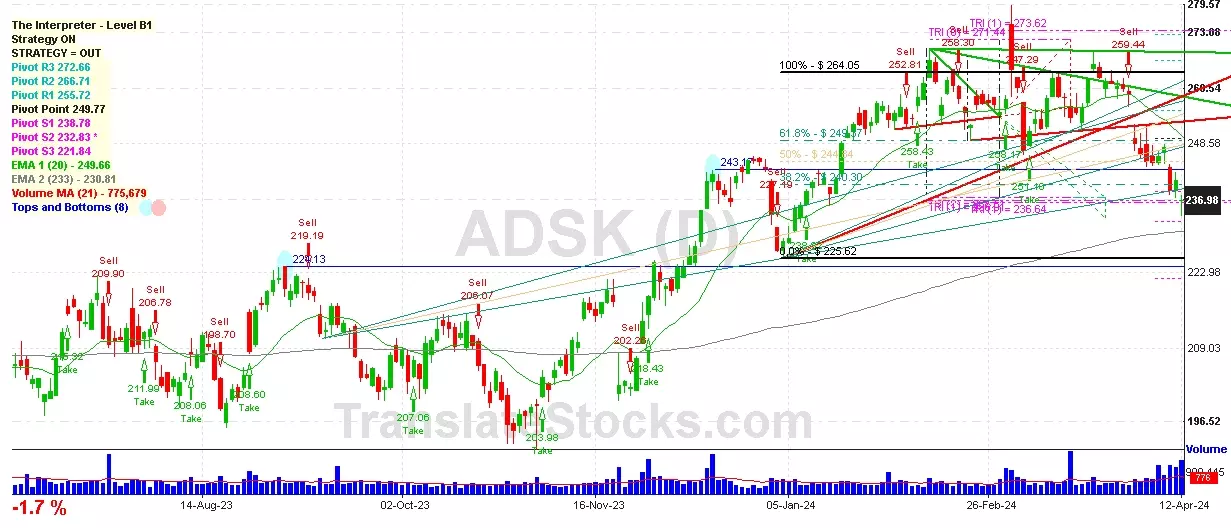
| 001 10 Apr 2024 | Sell Price: 266.86 | Profit: Open Day2 ($ 265.38) | Abandoned Baby | Sell |
| 002 18 Mar 2024 | Buy Price: 272.60 | Profit: Close Day1 ($ 273.24) | Abandoned Baby | Buy |
| 003 13 Mar 2024 | Sell Price: 269.73 | Profit: Open Day2 ($ 269.30) | Dark Cloud Cover | Sell |
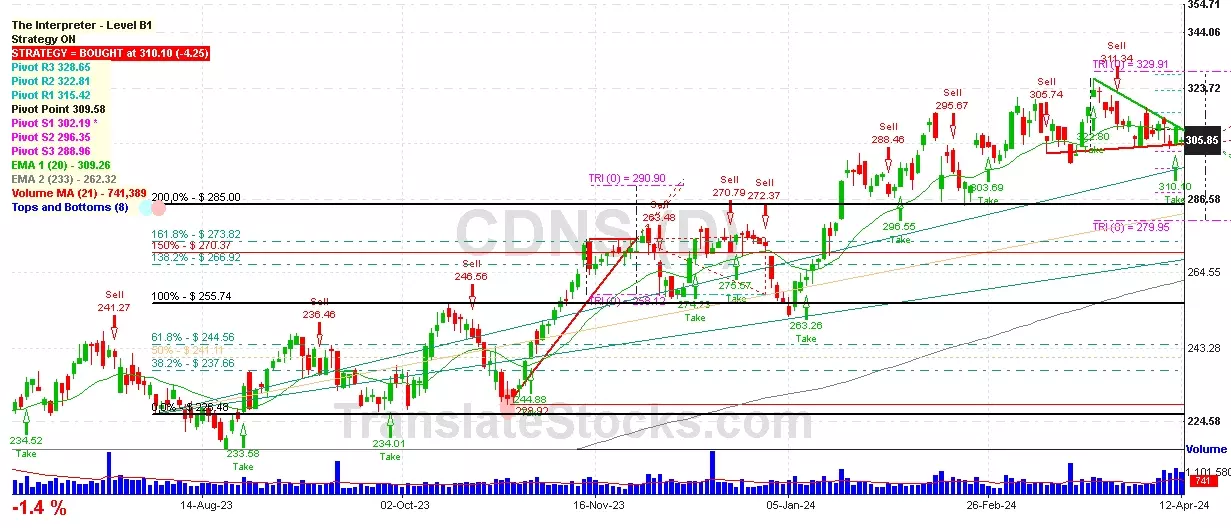
| 004 22 Feb 2024 | Buy Price: 306.62 | Profit: Open Day1 ($ 309.10) | Abandoned Baby | Buy |
| 005 16 Feb 2024 | Sell Price: 302.67 | Profit: Close Day1 ($ 301.98) | Engulfing | Sell |
| 006 14 Feb 2024 | Buy Price: 302.24 | Profit: Open Day1 ($ 304.54) | Abandoned Baby | Buy |
| 007 25 Jan 2024 | Sell Price: 292.36 | Profit: Close Day1 ($ 288.63) | Engulfing | Sell |
| 008 20 Dec 2023 | Sell Price: 270.15 | Loss: Close Day2 ($ 272.57) | Abandoned Baby | Sell |
| 009 07 Dec 2023 | Buy Price: 272.38 | Profit: Close Day1 ($ 273.41) | Abandoned Baby | Buy |
| 010 15 Nov 2023 | Sell Price: 231.51 | Loss: Close Day2 ($ 231.66) | Dark Cloud Cover | Sell |
| 011 13 Nov 2023 | Sell Price: 226.30 | Loss: Close Day2 ($ 231.51) | Abandoned Baby | Sell |
| 012 12 Oct 2023 | Sell Price: 215.75 | Profit: Close Day1 ($ 214.89) | Engulfing | Sell |
| 013 06 Oct 2023 | Buy Price: 213.63 | Profit: Close Day1 ($ 217.75) | Engulfing | Buy |
| 014 29 Sep 2023 | Buy Price: 214.85 | Loss: Close Day2 ($ 207.30) | Abandoned Baby | Buy |
| 015 24 Aug 2023 | Sell Price: 224.87 | Loss: Close Day2 ($ 236.30) | Engulfing | Sell |
| 016 14 Aug 2023 | Buy Price: 228.11 | Profit: Close Day1 ($ 230.89) | Engulfing | Buy |
| 017 28 Jun 2023 | Sell Price: 222.96 | Loss: Close Day2 ($ 225.89) | Dark Cloud Cover | Sell |
| 018 30 May 2023 | Sell Price: 209.08 | Profit: Open Day1 ($ 207.82) | Engulfing | Sell |
| 019 24 May 2023 | Buy Price: 196.19 | Profit: Open Day1 ($ 198.65) | Engulfing | Buy |
| 020 12 May 2023 | Buy Price: 182.76 | Profit: Close Day1 ($ 185.46) | Engulfing | Buy |
| 021One Year Average | Both Sides Result for 20 Signals |
Loss: $ -2.73 ($ -0.14 / Signal) |
All of Them | Buy + Sell |
| Simple Moving Averages (SMA) Period | Value $ | Signal | Exponential Moving Averages (EMA) Period | Value $ | Signal | |
|---|---|---|---|---|---|---|
| 2 | 256.33 | SELL | 2 | 256.32 | SELL | |
| 3 | 256.78 | SELL | 3 | 257.14 | SELL | |
| 5 | 258.73 | SELL | 5 | 258.91 | SELL | |
| 8 | 262.51 | SELL | 8 | 261.16 | SELL | |
| 13 | 265.12 | SELL | 13 | 263.91 | SELL | |
| 21 | 268.99 | SELL | 21 | 267.15 | SELL | |
| 34 | 269.72 | SELL | 34 | 270.89 | SELL | |
| 55 | 280.72 | SELL | 55 | 273.12 | SELL | |
| 90 | 279.94 | SELL | 90 | 270.67 | SELL | |
| 200 | 252.34 | BUY | 200 | 253.77 | BUY |
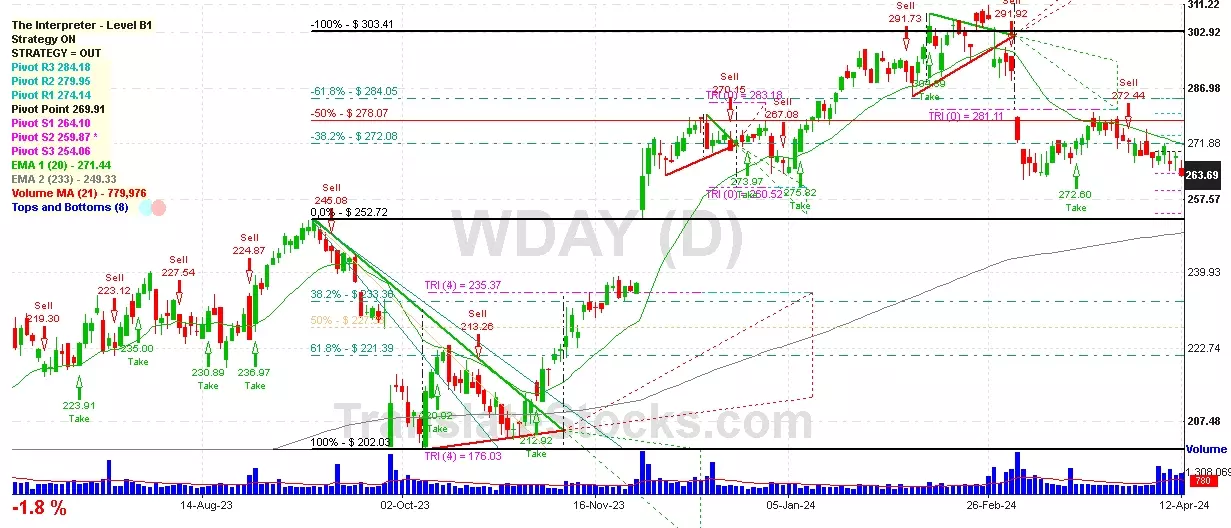
Workday Inc-class A
IPO: 2012-12-10
Ticker: WDAYIndices: Nasdaq 100,
Exchange: Nasdaq Nms - Global Market (US - USD)
Website: https://www.workday.com/
Phone:
Common Stock
Technology (
Services-computer Processing & Data Preparation

 Click to Enlarge