| Date | Price $ | Result % | Candle Name | Side |
|---|---|---|---|---|
| 001 11 Apr 2024 | Buy Price: 90.37 | Profit: Open Day2 ($ 90.43) | Abandoned Baby | Buy |
| 002 09 Oct 2023 | Buy Price: 82.09 | Profit: Close Day1 ($ 83.67) | Engulfing | Buy |
| 003 09 Oct 2023 | Buy Price: 82.12 | Profit: Close Day1 ($ 83.67) | Piercing Line | Buy |
| 004 25 Sep 2023 | Buy Price: 83.19 | Loss: Close Day2 ($ 80.20) | Piercing Line | Buy |
| 005 19 Sep 2023 | Sell Price: 83.74 | Loss: Close Day2 ($ 83.74) | Engulfing | Sell |
| 006 14 Jun 2023 | Sell Price: 81.54 | Profit: Open Day1 ($ 81.51) | Engulfing | Sell |
| 007 14 Jun 2023 | Sell Price: 81.52 | Profit: Open Day1 ($ 81.51) | Dark Cloud Cover | Sell |
| 008One Year Average | Both Sides Result for 7 Signals |
Profit: $ 0.23 ($ 0.03 / Signal) |
All of Them | Buy + Sell |
| Simple Moving Averages (SMA) Period | Value $ | Signal | Exponential Moving Averages (EMA) Period | Value $ | Signal | |
|---|---|---|---|---|---|---|
| 2 | 89.45 | SELL | 2 | 89.41 | SELL | |
| 3 | 89.75 | SELL | 3 | 89.67 | SELL | |
| 5 | 90.29 | SELL | 5 | 90.06 | SELL | |
| 8 | 90.68 | SELL | 8 | 90.46 | SELL | |
| 13 | 91.23 | SELL | 13 | 90.88 | SELL | |
| 21 | 91.60 | SELL | 21 | 91.21 | SELL | |
| 34 | 91.87 | SELL | 34 | 91.28 | SELL | |
| 55 | 90.97 | SELL | 55 | 90.96 | SELL | |
| 90 | 90.42 | SELL | 90 | 90.04 | SELL | |
| 200 | 86.66 | BUY | 200 | 86.80 | BUY |
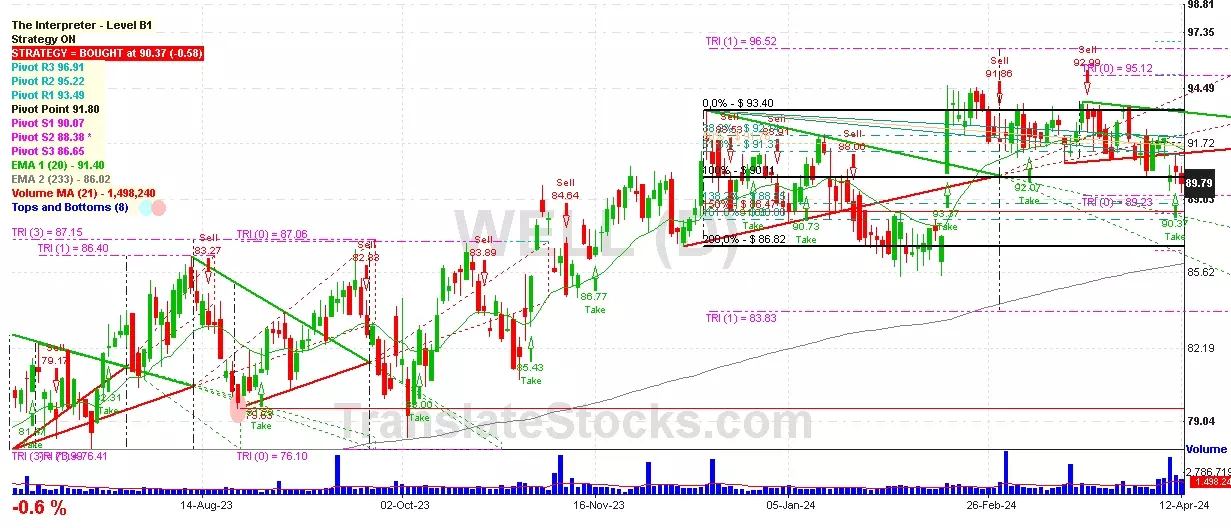
Welltower Inc
IPO: 1992-12-17
Ticker: WELLIndices: S&P 500,
Exchange: New York Stock Exchange, Inc. (US - USD)
Website: http://www.welltower.com/
Phone:
REIT (Real Estate Investment Trust)
Real Estate & Construction (
Real Estate Investment Trusts

 Click to Enlarge