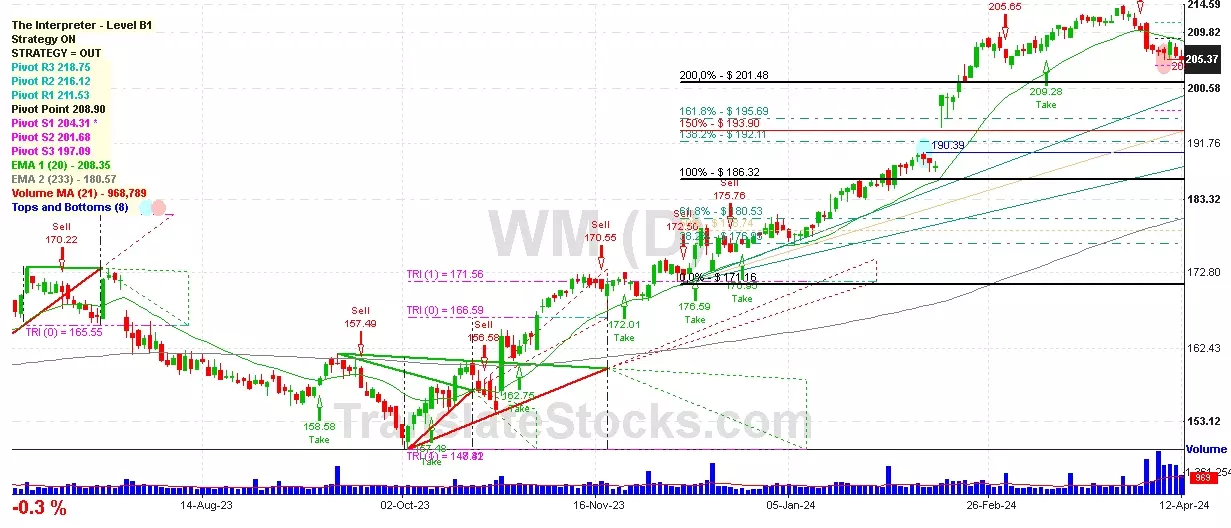
Hey Friend, I'm analysing WASTE MANAGEMENT INC (WM), and it is between the Support of $ 204.31 (PivotS1) and the Resistance of $ 208.90 (Pivot). The stock is also approaching the line of PivotS1 at $ 204.31, and if it goes below this line it could reach the next Support of 200% of Fibonacci at $ 201.48.

| Date | Price $ | Result % | Candle Name | Side |
|---|---|---|---|---|
| 001 15 Mar 2024 | Sell Price: 210.02 | Loss: Close Day2 ($ 212.08) | Abandoned Baby | Sell |
| 002 15 Mar 2024 | Buy Price: 210.53 | Profit: Open Day1 ($ 210.59) | Piercing Line | Buy |
| 003 07 Mar 2024 | Sell Price: 207.26 | Profit: Open Day1 ($ 206.84) | Dark Cloud Cover | Sell |
| 004 01 Feb 2024 | Buy Price: 188.42 | Loss: Close Day2 ($ 188.20) | Engulfing | Buy |
| 005 31 Jan 2024 | Sell Price: 185.63 | Profit: Open Day1 ($ 185.52) | Engulfing | Sell |
| 006 31 Jan 2024 | Sell Price: 185.68 | Profit: Open Day1 ($ 185.52) | Dark Cloud Cover | Sell |
| 007 21 Dec 2023 | Buy Price: 176.81 | Profit: Open Day1 ($ 177.44) | Engulfing | Buy |
| 008 11 Dec 2023 | Buy Price: 173.38 | Profit: Open Day1 ($ 174.82) | Abandoned Baby | Buy |
| 009 18 Oct 2023 | Sell Price: 159.05 | Profit: Open Day1 ($ 158.31) | Engulfing | Sell |
| 010 20 Sep 2023 | Buy Price: 160.05 | Loss: Close Day2 ($ 156.47) | Abandoned Baby | Buy |
| 011 29 Aug 2023 | Buy Price: 158.13 | Profit: Open Day1 ($ 159.03) | Piercing Line | Buy |
| 012 23 Aug 2023 | Buy Price: 158.38 | Loss: Close Day2 ($ 158.33) | Abandoned Baby | Buy |
| 013 24 Jul 2023 | Sell Price: 171.80 | Profit: Open Day1 ($ 171.65) | Engulfing | Sell |
| 014 14 Jul 2023 | Buy Price: 168.56 | Loss: Close Day2 ($ 166.61) | Piercing Line | Buy |
| 015 20 Jun 2023 | Sell Price: 164.86 | Profit: Open Day1 ($ 164.76) | Abandoned Baby | Sell |
| 016 11 May 2023 | Sell Price: 170.19 | Profit: Close Day1 ($ 169.24) | Engulfing | Sell |
| 017 11 May 2023 | Sell Price: 170.26 | Profit: Close Day1 ($ 169.24) | Dark Cloud Cover | Sell |
| 018One Year Average | Both Sides Result for 17 Signals |
Loss: $ -1.19 ($ -0.07 / Signal) |
All of Them | Buy + Sell |
| Simple Moving Averages (SMA) Period | Value $ | Signal | Exponential Moving Averages (EMA) Period | Value $ | Signal | |
|---|---|---|---|---|---|---|
| 2 | 206.07 | BUY | 2 | 206.49 | BUY | |
| 3 | 206.10 | BUY | 3 | 206.24 | BUY | |
| 5 | 205.73 | BUY | 5 | 206.11 | BUY | |
| 8 | 206.02 | BUY | 8 | 206.32 | BUY | |
| 13 | 206.60 | BUY | 13 | 206.92 | BUY | |
| 21 | 208.79 | SELL | 21 | 207.35 | SELL | |
| 34 | 209.05 | SELL | 34 | 206.43 | BUY | |
| 55 | 204.96 | BUY | 55 | 203.00 | BUY | |
| 90 | 195.27 | BUY | 90 | 196.74 | BUY | |
| 200 | 177.56 | BUY | 200 | 183.96 | BUY |
Waste Management Inc
IPO: 1993-07-20
Ticker: WMIndices: S&P 500,
Exchange: New York Stock Exchange, Inc. (US - USD)
Website: https://www.wm.com/
Phone:
Common Stock
Energy & Transportation (
Refuse Systems
 Click to Enlarge