| Date | Price $ | Result % | Candle Name | Side |
|---|---|---|---|---|
| 001 01 Apr 2024 | Sell Price: 87.49 | Profit: Close Day1 ($ 87.26) | Abandoned Baby | Sell |
| 002 20 Feb 2024 | Sell Price: 81.98 | Loss: Close Day2 ($ 85.71) | Abandoned Baby | Sell |
| 003 26 Jan 2024 | Sell Price: 81.47 | Profit: Open Day1 ($ 80.93) | Abandoned Baby | Sell |
| 004 11 Oct 2023 | Buy Price: 64.14 | Profit: Open Day1 ($ 64.41) | Engulfing | Buy |
| 005 29 Sep 2023 | Sell Price: 63.49 | Profit: Open Day1 ($ 63.22) | Engulfing | Sell |
| 006 21 Sep 2023 | Sell Price: 65.13 | Profit: Open Day1 ($ 64.50) | Abandoned Baby | Sell |
| 007 07 Sep 2023 | Buy Price: 61.78 | Profit: Open Day1 ($ 61.92) | Abandoned Baby | Buy |
| 008 07 Sep 2023 | Buy Price: 61.77 | Profit: Open Day1 ($ 61.92) | Engulfing | Buy |
| 009 29 Jun 2023 | Buy Price: 59.12 | Profit: Open Day1 ($ 59.35) | Engulfing | Buy |
| 010 21 Jun 2023 | Buy Price: 58.89 | Profit: Open Day1 ($ 58.95) | Piercing Line | Buy |
| 011 26 May 2023 | Buy Price: 56.15 | Profit: Open Day1 ($ 56.39) | Piercing Line | Buy |
| 012 12 May 2023 | Buy Price: 58.92 | Profit: Open Day1 ($ 59.14) | Abandoned Baby | Buy |
| 013 11 May 2023 | Sell Price: 58.88 | Loss: Close Day2 ($ 59.02) | Abandoned Baby | Sell |
| 014One Year Average | Both Sides Result for 13 Signals |
Loss: $ -0.89 ($ -0.07 / Signal) |
All of Them | Buy + Sell |
| Simple Moving Averages (SMA) Period | Value $ | Signal | Exponential Moving Averages (EMA) Period | Value $ | Signal | |
|---|---|---|---|---|---|---|
| 2 | 82.92 | BUY | 2 | 82.94 | BUY | |
| 3 | 82.27 | BUY | 3 | 82.62 | BUY | |
| 5 | 81.93 | BUY | 5 | 82.43 | BUY | |
| 8 | 82.00 | BUY | 8 | 82.64 | BUY | |
| 13 | 83.41 | BUY | 13 | 83.22 | BUY | |
| 21 | 84.87 | SELL | 21 | 83.80 | SELL | |
| 34 | 84.99 | SELL | 34 | 83.85 | SELL | |
| 55 | 84.05 | SELL | 55 | 82.81 | BUY | |
| 90 | 80.16 | BUY | 90 | 80.37 | BUY | |
| 200 | 71.69 | BUY | 200 | 74.83 | BUY |
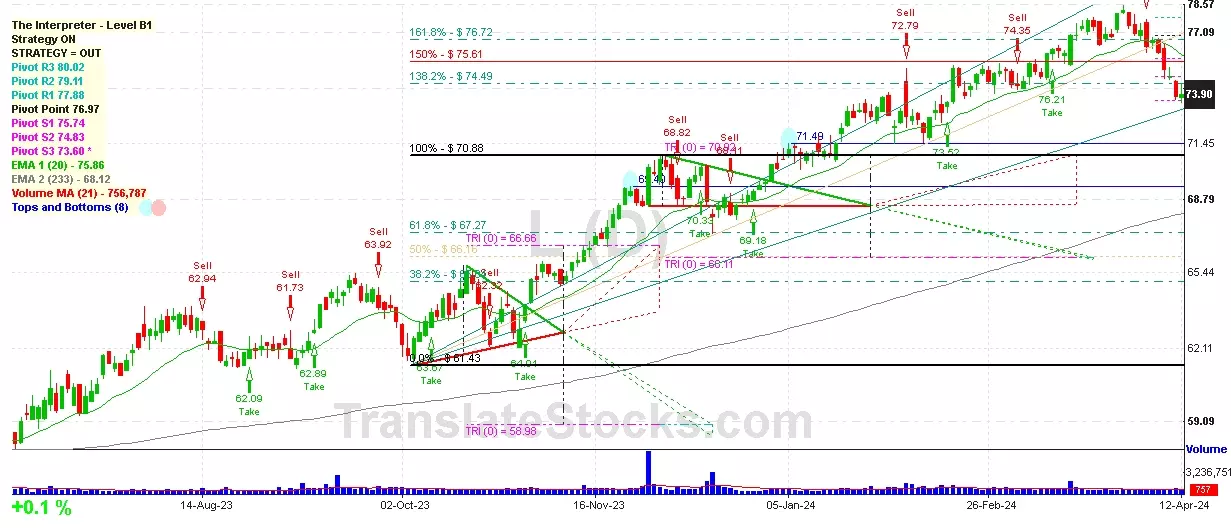
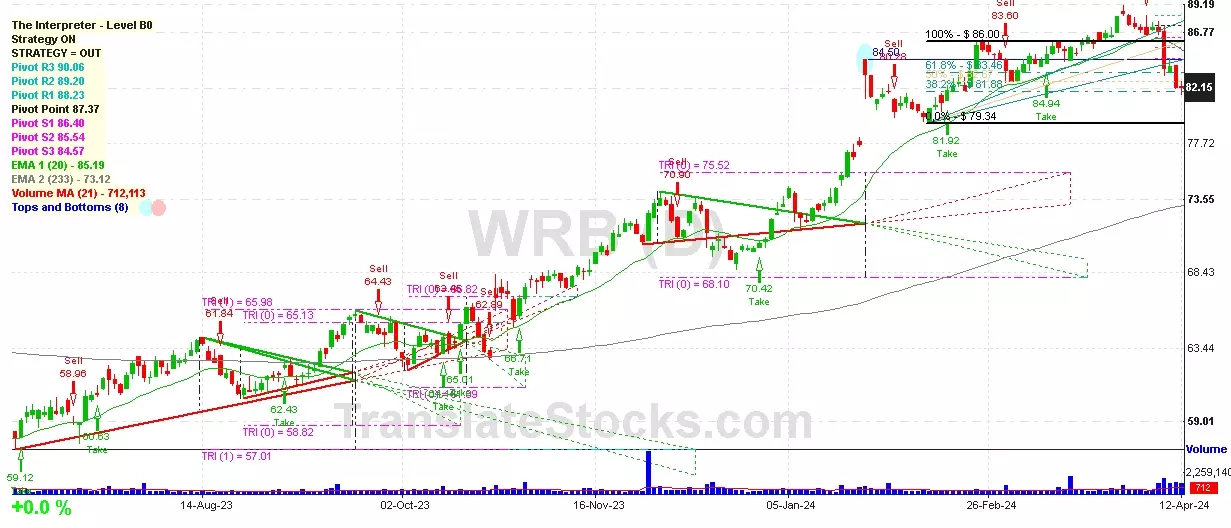
Wr Berkley Corp
IPO: 1973-10-19
Ticker: WRBIndices: S&P 500,
Exchange: New York Stock Exchange, Inc. (US - USD)
Website: https://www.berkley.com
Phone:
Common Stock
Finance (
Fire, Marine & Casualty Insurance

 Click to Enlarge