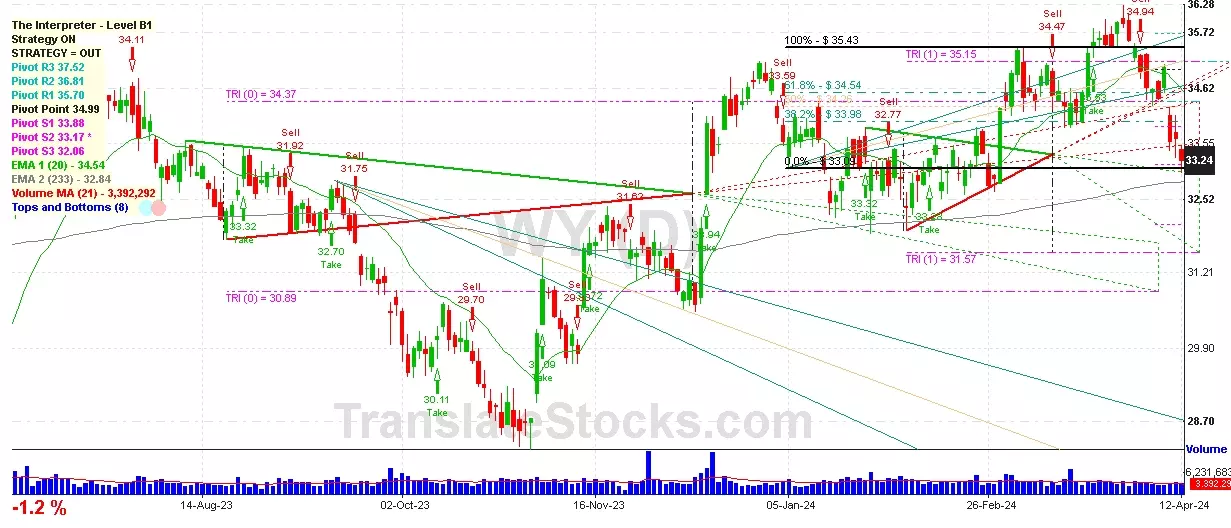
Hey Friend, I'm analysing WEYERHAEUSER CO (WY), and it is between the Support of $ 33.17 (PivotS2) and the Resistance of $ 33.88 (PivotS1). The stock is also approaching the line of PivotS2 at $ 33.17, and if it goes below this line it could reach the next Support of 0% of Fibonacci at $ 33.09.

| Date | Price $ | Result % | Candle Name | Side |
|---|---|---|---|---|
| 001 15 Mar 2024 | Buy Price: 34.39 | Profit: Open Day1 ($ 34.40) | Engulfing | Buy |
| 002 15 Mar 2024 | Buy Price: 34.33 | Profit: Open Day1 ($ 34.40) | Piercing Line | Buy |
| 003 20 Feb 2024 | Buy Price: 33.06 | Profit: Open Day1 ($ 33.10) | Engulfing | Buy |
| 004 24 Aug 2023 | Sell Price: 32.77 | Profit: Close Day1 ($ 32.63) | Engulfing | Sell |
| 005 18 Aug 2023 | Buy Price: 32.30 | Profit: Close Day1 ($ 32.41) | Piercing Line | Buy |
| 006 16 May 2023 | Sell Price: 29.31 | Loss: Close Day2 ($ 29.52) | Abandoned Baby | Sell |
| 007One Year Average | Both Sides Result for 6 Signals |
Profit: $ 0.16 ($ 0.03 / Signal) |
All of Them | Buy + Sell |
| Simple Moving Averages (SMA) Period | Value $ | Signal | Exponential Moving Averages (EMA) Period | Value $ | Signal | |
|---|---|---|---|---|---|---|
| 2 | 31.75 | SELL | 2 | 31.78 | SELL | |
| 3 | 32.06 | SELL | 3 | 32.04 | SELL | |
| 5 | 32.61 | SELL | 5 | 32.49 | SELL | |
| 8 | 33.27 | SELL | 8 | 33.00 | SELL | |
| 13 | 33.94 | SELL | 13 | 33.53 | SELL | |
| 21 | 34.53 | SELL | 21 | 33.92 | SELL | |
| 34 | 34.55 | SELL | 34 | 34.07 | SELL | |
| 55 | 34.01 | SELL | 55 | 33.95 | SELL | |
| 90 | 33.76 | SELL | 90 | 33.60 | SELL | |
| 200 | 32.70 | SELL | 200 | 32.89 | SELL |
Weyerhaeuser Co
IPO: 1963-12-06
Ticker: WYIndices: S&P 500,
Exchange: New York Stock Exchange, Inc. (US - USD)
Website: https://www.weyerhaeuser.com/
Phone:
REIT (Real Estate Investment Trust)
Real Estate & Construction (
Real Estate Investment Trusts
 Click to Enlarge