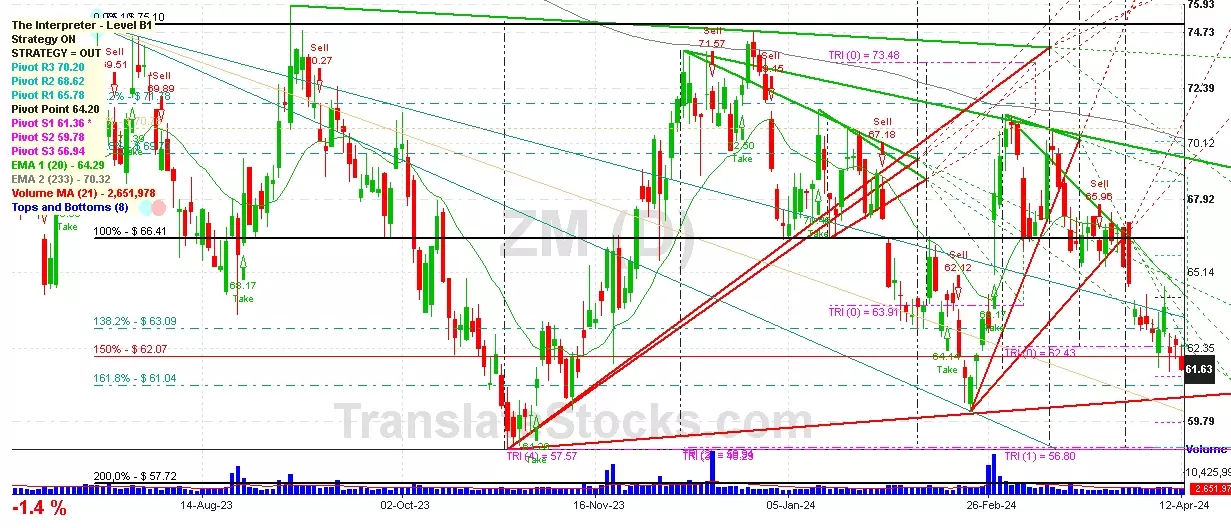
Hey Friend, I'm analysing ZOOM VIDEO COMMUNICATIONS A (ZM), and it is between the Support of $ 61.36 (PivotS1) and the Resistance of $ 62.43 (Triangle Projection Level 0). The stock is also approaching the line of PivotS1 at $ 61.36, and if it goes below this line it could reach the next Support of 100% of Fibonacci at $ 60.14.

| Date | Price $ | Result % | Candle Name | Side |
|---|---|---|---|---|
| 001 08 Apr 2024 | Buy Price: 63.01 | Profit: Close Day1 ($ 63.85) | Piercing Line | Buy |
| 002 26 Mar 2024 | Sell Price: 66.35 | Profit: Close Day2 ($ 65.37) | Dark Cloud Cover | Sell |
| 003 25 Mar 2024 | Buy Price: 66.71 | Profit: Open Day1 ($ 67.00) | Engulfing | Buy |
| 004 21 Mar 2024 | Sell Price: 66.54 | Profit: Open Day1 ($ 66.35) | Engulfing | Sell |
| 005 13 Mar 2024 | Sell Price: 68.44 | Profit: Close Day1 ($ 67.26) | Abandoned Baby | Sell |
| 006 07 Feb 2024 | Buy Price: 63.88 | Profit: Close Day1 ($ 63.90) | Abandoned Baby | Buy |
| 007 19 Jan 2024 | Buy Price: 69.04 | Profit: Open Day1 ($ 69.53) | Abandoned Baby | Buy |
| 008 05 Jan 2024 | Buy Price: 66.96 | Profit: Open Day1 ($ 67.20) | Piercing Line | Buy |
| 009 20 Dec 2023 | Sell Price: 69.86 | Loss: Close Day2 ($ 72.50) | Abandoned Baby | Sell |
| 010 19 Dec 2023 | Buy Price: 72.42 | Loss: Close Day2 ($ 71.90) | Abandoned Baby | Buy |
| 011 15 Dec 2023 | Sell Price: 71.57 | Profit: Open Day1 ($ 70.86) | Engulfing | Sell |
| 012 01 Dec 2023 | Buy Price: 70.29 | Loss: Close Day2 ($ 68.72) | Engulfing | Buy |
| 013 06 Nov 2023 | Sell Price: 61.82 | Loss: Close Day2 ($ 61.83) | Engulfing | Sell |
| 014 24 Oct 2023 | Buy Price: 62.14 | Loss: Close Day2 ($ 59.50) | Abandoned Baby | Buy |
| 015 11 Oct 2023 | Sell Price: 64.82 | Profit: Close Day1 ($ 63.47) | Engulfing | Sell |
| 016 06 Oct 2023 | Buy Price: 65.48 | Profit: Close Day1 ($ 66.10) | Piercing Line | Buy |
| 017 14 Sep 2023 | Buy Price: 71.57 | Loss: Close Day2 ($ 70.63) | Abandoned Baby | Buy |
| 018 24 Aug 2023 | Sell Price: 66.95 | Profit: Open Day1 ($ 66.67) | Dark Cloud Cover | Sell |
| 019 15 Jun 2023 | Buy Price: 69.94 | Profit: Open Day1 ($ 70.12) | Engulfing | Buy |
| 020 07 Jun 2023 | Sell Price: 66.50 | Loss: Close Day2 ($ 67.14) | Engulfing | Sell |
| 021 02 Jun 2023 | Sell Price: 67.09 | Profit: Open Day1 ($ 66.75) | Dark Cloud Cover | Sell |
| 022 31 May 2023 | Buy Price: 67.13 | Profit: Close Day1 ($ 67.83) | Engulfing | Buy |
| 023 30 May 2023 | Sell Price: 65.68 | Profit: Open Day1 ($ 65.36) | Dark Cloud Cover | Sell |
| 024 25 May 2023 | Buy Price: 65.12 | Profit: Open Day1 ($ 65.43) | Engulfing | Buy |
| 025 15 May 2023 | Buy Price: 66.03 | Profit: Open Day2 ($ 66.09) | Engulfing | Buy |
| 026 12 May 2023 | Sell Price: 63.69 | Profit: Open Day1 ($ 63.40) | Abandoned Baby | Sell |
| 027 09 May 2023 | Buy Price: 63.56 | Profit: Open Day1 ($ 64.14) | Engulfing | Buy |
| 028 08 May 2023 | Sell Price: 62.93 | Profit: Open Day1 ($ 62.26) | Engulfing | Sell |
| 029 04 May 2023 | Buy Price: 62.22 | Profit: Open Day1 ($ 63.13) | Engulfing | Buy |
| 030One Year Average | Both Sides Result for 29 Signals |
Profit: $ 2.59 ($ 0.09 / Signal) |
All of Them | Buy + Sell |
| Simple Moving Averages (SMA) Period | Value $ | Signal | Exponential Moving Averages (EMA) Period | Value $ | Signal | |
|---|---|---|---|---|---|---|
| 2 | 61.64 | BUY | 2 | 61.41 | BUY | |
| 3 | 60.94 | BUY | 3 | 61.13 | BUY | |
| 5 | 60.44 | BUY | 5 | 60.82 | BUY | |
| 8 | 60.10 | BUY | 8 | 60.83 | BUY | |
| 13 | 61.08 | BUY | 13 | 61.30 | BUY | |
| 21 | 62.40 | SELL | 21 | 62.16 | SELL | |
| 34 | 64.25 | SELL | 34 | 63.22 | SELL | |
| 55 | 64.61 | SELL | 55 | 64.25 | SELL | |
| 90 | 66.36 | SELL | 90 | 65.17 | SELL | |
| 200 | 66.91 | SELL | 200 | 67.75 | SELL |
Zoom Video Communications-a
IPO: 2019-04-18
Ticker: ZMIndices: Nasdaq 100,
Exchange: Nasdaq Nms - Global Market (US - USD)
Website: https://www.zoom.us
Phone:
Common Stock
Technology (
Services-computer Programming, Data Processing, Etc.
 Click to Enlarge