
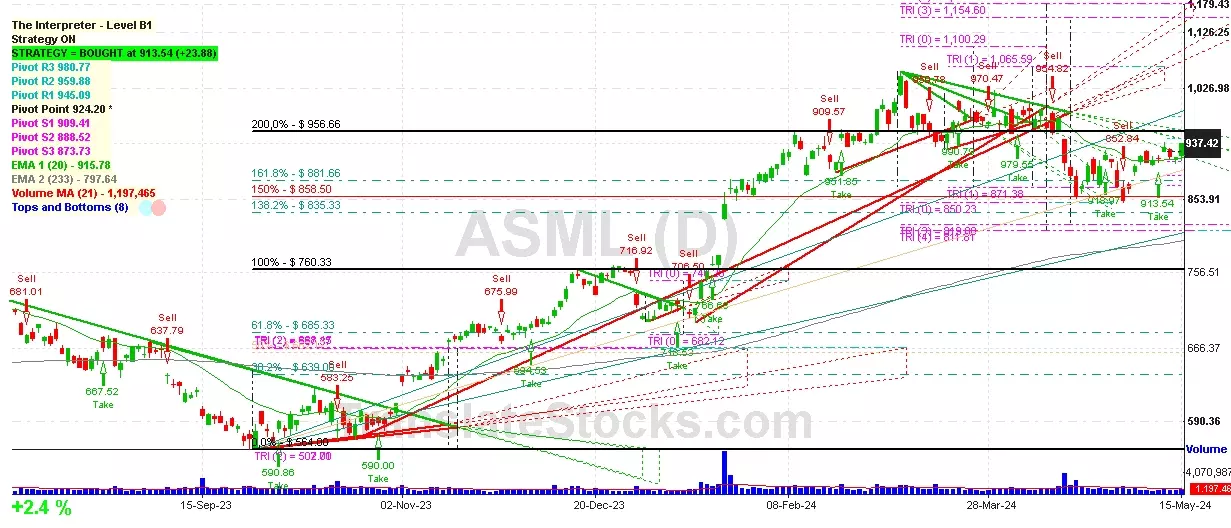
Hey Friend, I'm analysing ASML HOLDING NV NY REG SHS (ASML), and it is between the Support of $ 924.20 (Pivot) and the Resistance of $ 945.09 (PivotR1). The stock is also approaching the line of PivotR1 at $ 945.09, and if it goes above this line it could reach the next Resistance of 200% of Fibonacci at $ 956.66.

| Date | Price $ | Result % | Candle Name | Side |
|---|---|---|---|---|
| 001 07 May 2024 | Sell Price: 908.22 | Profit: Open Day1 ($ 904.44) | Engulfing | Sell |
| 002 24 Apr 2024 | Sell Price: 892.32 | Profit: Open Day1 ($ 875.00) | Dark Cloud Cover | Sell |
| 003 11 Apr 2024 | Buy Price: 992.18 | Loss: Close Day2 ($ 954.82) | Abandoned Baby | Buy |
| 004 04 Apr 2024 | Sell Price: 953.41 | Loss: Close Day2 ($ 982.71) | Engulfing | Sell |
| 005 03 Apr 2024 | Buy Price: 980.27 | Profit: Open Day1 ($ 991.99) | Engulfing | Buy |
| 006 01 Apr 2024 | Buy Price: 992.95 | Loss: Close Day2 ($ 980.27) | Abandoned Baby | Buy |
| 007 22 Mar 2024 | Sell Price: 979.96 | Profit: Open Day1 ($ 979.13) | Abandoned Baby | Sell |
| 008 05 Mar 2024 | Sell Price: 968.84 | Loss: Close Day2 ($ 1,047.39) | Abandoned Baby | Sell |
| 009 23 Feb 2024 | Sell Price: 933.25 | Loss: Close Day2 ($ 941.37) | Engulfing | Sell |
| 010 22 Feb 2024 | Buy Price: 951.85 | Profit: Open Day1 ($ 952.28) | Abandoned Baby | Buy |
| 011 16 Feb 2024 | Sell Price: 928.94 | Profit: Open Day1 ($ 918.60) | Engulfing | Sell |
| 012 14 Feb 2024 | Buy Price: 924.44 | Profit: Open Day1 ($ 929.08) | Abandoned Baby | Buy |
| 013 26 Jan 2024 | Sell Price: 867.75 | Profit: Open Day1 ($ 867.58) | Abandoned Baby | Sell |
| 014 17 Jan 2024 | Buy Price: 712.27 | Profit: Open Day1 ($ 724.68) | Engulfing | Buy |
| 015 12 Jan 2024 | Sell Price: 713.22 | Profit: Open Day1 ($ 707.99) | Abandoned Baby | Sell |
| 016 05 Jan 2024 | Buy Price: 703.34 | Profit: Open Day1 ($ 712.65) | Abandoned Baby | Buy |
| 017 06 Dec 2023 | Sell Price: 692.08 | Loss: Close Day2 ($ 696.43) | Dark Cloud Cover | Sell |
| 018 29 Nov 2023 | Buy Price: 687.61 | Profit: Open Day2 ($ 688.17) | Abandoned Baby | Buy |
| 019 08 Nov 2023 | Buy Price: 639.29 | Profit: Open Day1 ($ 646.39) | Abandoned Baby | Buy |
| 020 06 Nov 2023 | Sell Price: 637.44 | Profit: Open Day1 ($ 633.82) | Abandoned Baby | Sell |
| 021 19 Oct 2023 | Buy Price: 587.73 | Profit: Open Day1 ($ 588.95) | Abandoned Baby | Buy |
| 022 04 Oct 2023 | Buy Price: 590.86 | Profit: Close Day2 ($ 597.36) | Abandoned Baby | Buy |
| 023 02 Oct 2023 | Sell Price: 582.18 | Profit: Open Day1 ($ 574.95) | Abandoned Baby | Sell |
| 024 24 Aug 2023 | Sell Price: 647.82 | Profit: Open Day1 ($ 643.68) | Engulfing | Sell |
| 025 14 Aug 2023 | Buy Price: 666.55 | Loss: Close Day2 ($ 646.44) | Piercing Line | Buy |
| 026 08 Aug 2023 | Sell Price: 679.37 | Profit: Close Day1 ($ 672.49) | Abandoned Baby | Sell |
| 027 31 Jul 2023 | Sell Price: 716.41 | Profit: Open Day1 ($ 711.45) | Dark Cloud Cover | Sell |
| 028 10 Jul 2023 | Buy Price: 709.83 | Profit: Open Day2 ($ 729.52) | Abandoned Baby | Buy |
| 029 26 Jun 2023 | Buy Price: 700.24 | Profit: Open Day1 ($ 706.90) | Abandoned Baby | Buy |
| 030 22 Jun 2023 | Buy Price: 717.41 | Loss: Close Day2 ($ 700.24) | Piercing Line | Buy |
| 031 02 Jun 2023 | Sell Price: 724.65 | Profit: Open Day1 ($ 724.64) | Dark Cloud Cover | Sell |
| 032 30 May 2023 | Sell Price: 728.26 | Profit: Open Day1 ($ 727.07) | Dark Cloud Cover | Sell |
| 033 25 May 2023 | Buy Price: 708.48 | Profit: Open Day1 ($ 716.65) | Abandoned Baby | Buy |
| 034One Year Average | Both Sides Result for 33 Signals |
Loss: $ -53.53 ($ -1.62 / Signal) |
All of Them | Buy + Sell |
| Simple Moving Averages (SMA) Period | Value $ | Signal | Exponential Moving Averages (EMA) Period | Value $ | Signal | |
|---|---|---|---|---|---|---|
| 2 | 926.23 | BUY | 2 | 930.47 | BUY | |
| 3 | 923.23 | BUY | 3 | 927.19 | BUY | |
| 5 | 922.70 | BUY | 5 | 922.76 | BUY | |
| 8 | 918.77 | BUY | 8 | 917.83 | BUY | |
| 13 | 904.39 | BUY | 13 | 914.39 | BUY | |
| 21 | 900.03 | BUY | 21 | 916.22 | BUY | |
| 34 | 928.74 | BUY | 34 | 920.82 | BUY | |
| 55 | 946.30 | SELL | 55 | 916.34 | BUY | |
| 90 | 909.90 | BUY | 90 | 890.68 | BUY | |
| 200 | 769.35 | BUY | 200 | 812.94 | BUY |
Asml Holding Nv-ny Reg Shs
IPO: 1995-02-01
Ticker: ASMLIndices: Nasdaq 100,
Exchange: Nyse Euronext - Euronext Amsterdam (NL - USD)
Website: https://www.asml.com/
Phone:
NY Reg Shrs
Technology (
Special Industry Machinery, Nec
 Click to Enlarge