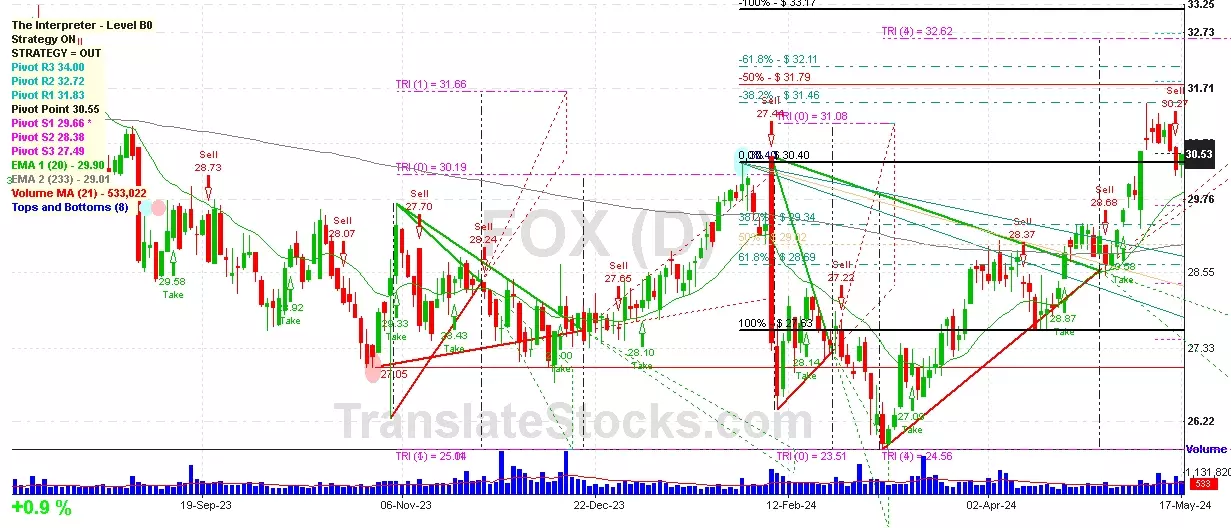
Hey Friend, I'm analysing FOX CORP CLASS B (FOX), and it is between the Support of $ 30.40 (0% of Fibonacci) and the Resistance of $ 30.55 (Pivot). The stock is also approaching the line of Pivot at $ 30.55, and if it goes above this line it could reach the next Resistance of Triangle projection at $31.08.

| Date | Price $ | Result % | Candle Name | Side |
|---|---|---|---|---|
| 001 10 Apr 2024 | Sell Price: 28.37 | Profit: Close Day1 ($ 28.24) | Abandoned Baby | Sell |
| 002 01 Mar 2024 | Sell Price: 26.99 | Profit: Open Day1 ($ 26.95) | Engulfing | Sell |
| 003 18 Jan 2024 | Buy Price: 28.58 | Profit: Open Day1 ($ 28.72) | Abandoned Baby | Buy |
| 004 16 Jan 2024 | Sell Price: 28.45 | Profit: Open Day1 ($ 28.26) | Abandoned Baby | Sell |
| 005 02 Jan 2024 | Buy Price: 28.14 | Loss: Close Day2 ($ 27.99) | Abandoned Baby | Buy |
| 006 15 Dec 2023 | Sell Price: 27.65 | Profit: Close Day1 ($ 27.63) | Engulfing | Sell |
| 007 01 Dec 2023 | Buy Price: 28.26 | Loss: Close Day2 ($ 27.46) | Abandoned Baby | Buy |
| 008 16 Nov 2023 | Sell Price: 28.14 | Loss: Close Day2 ($ 28.64) | Engulfing | Sell |
| 009 11 Oct 2023 | Sell Price: 28.80 | Profit: Close Day1 ($ 28.40) | Engulfing | Sell |
| 010 11 Oct 2023 | Sell Price: 28.81 | Profit: Open Day1 ($ 28.80) | Dark Cloud Cover | Sell |
| 011 24 May 2023 | Sell Price: 28.65 | Loss: Close Day2 ($ 29.25) | Engulfing | Sell |
| 012One Year Average | Both Sides Result for 11 Signals |
Loss: $ -1.12 ($ -0.10 / Signal) |
All of Them | Buy + Sell |
| Simple Moving Averages (SMA) Period | Value $ | Signal | Exponential Moving Averages (EMA) Period | Value $ | Signal | |
|---|---|---|---|---|---|---|
| 2 | 30.40 | BUY | 2 | 30.49 | BUY | |
| 3 | 30.47 | BUY | 3 | 30.51 | BUY | |
| 5 | 30.62 | SELL | 5 | 30.53 | SELL | |
| 8 | 30.68 | SELL | 8 | 30.45 | BUY | |
| 13 | 30.23 | BUY | 13 | 30.22 | BUY | |
| 21 | 29.77 | BUY | 21 | 29.86 | BUY | |
| 34 | 29.21 | BUY | 34 | 29.41 | BUY | |
| 55 | 28.44 | BUY | 55 | 28.99 | BUY | |
| 90 | 28.43 | BUY | 90 | 28.72 | BUY | |
| 200 | 28.66 | BUY | 200 | 28.86 | BUY |
Fox Corp - Class B
IPO: 2019-02-27
Ticker: FOXIndices: S&P 500,
Nasdaq 100,
Exchange: Nasdaq Nms - Global Market (US - USD)
Website: https://www.foxcorporation.com/
Phone:
Common Stock
Technology (
Television Broadcasting Stations
 Click to Enlarge