| Date | Price $ | Result % | Candle Name | Side |
|---|---|---|---|---|
| 001 09 Feb 2024 | Sell Price: 145.66 | Profit: Close Day1 ($ 144.45) | Engulfing | Sell |
| 002 02 Feb 2024 | Sell Price: 145.47 | Profit: Open Day1 ($ 144.36) | Dark Cloud Cover | Sell |
| 003 16 Jan 2024 | Sell Price: 129.47 | Profit: Open Day1 ($ 128.14) | Engulfing | Sell |
| 004 29 Sep 2023 | Sell Price: 120.15 | Profit: Open Day1 ($ 120.09) | Engulfing | Sell |
| 005 05 Sep 2023 | Sell Price: 116.74 | Profit: Close Day1 ($ 116.64) | Dark Cloud Cover | Sell |
| 006 07 Jul 2023 | Buy Price: 99.44 | Profit: Open Day1 ($ 99.52) | Abandoned Baby | Buy |
| 007One Year Average | Both Sides Result for 6 Signals |
Profit: $ 3.89 ($ 0.65 / Signal) |
All of Them | Buy + Sell |
| Simple Moving Averages (SMA) Period | Value $ | Signal | Exponential Moving Averages (EMA) Period | Value $ | Signal | |
|---|---|---|---|---|---|---|
| 2 | 146.47 | BUY | 2 | 146.67 | BUY | |
| 3 | 146.38 | BUY | 3 | 146.43 | BUY | |
| 5 | 145.81 | BUY | 5 | 146.20 | BUY | |
| 8 | 146.17 | BUY | 8 | 146.22 | BUY | |
| 13 | 145.18 | BUY | 13 | 146.99 | BUY | |
| 21 | 148.53 | SELL | 21 | 148.75 | SELL | |
| 34 | 154.68 | SELL | 34 | 150.47 | SELL | |
| 55 | 154.48 | SELL | 55 | 150.38 | SELL | |
| 90 | 148.95 | SELL | 90 | 147.13 | SELL | |
| 200 | 132.66 | BUY | 200 | 135.32 | BUY |
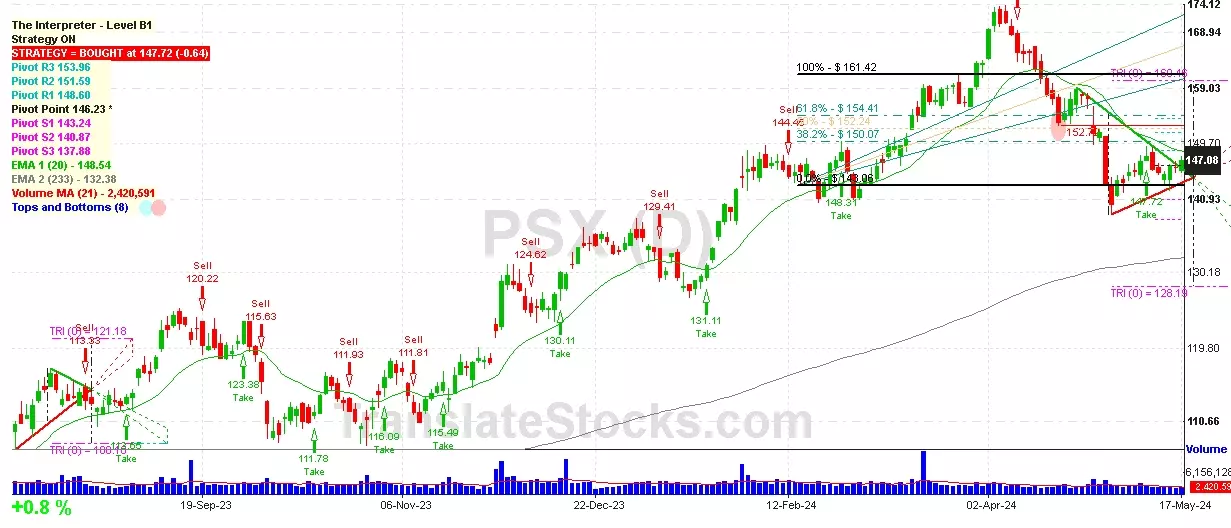
Phillips 66
IPO: 2012-04-12
Ticker: PSXIndices: S&P 500,
Exchange: New York Stock Exchange, Inc. (US - USD)
Website: http://www.phillips66.com
Phone:
Common Stock
Energy & Transportation (
Petroleum Refining

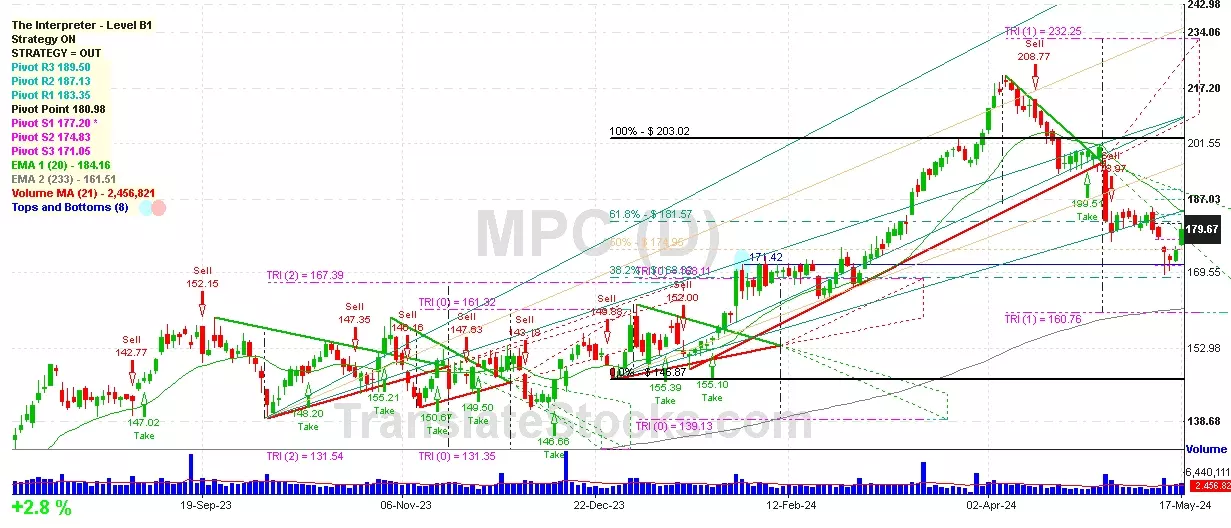
 Click to Enlarge
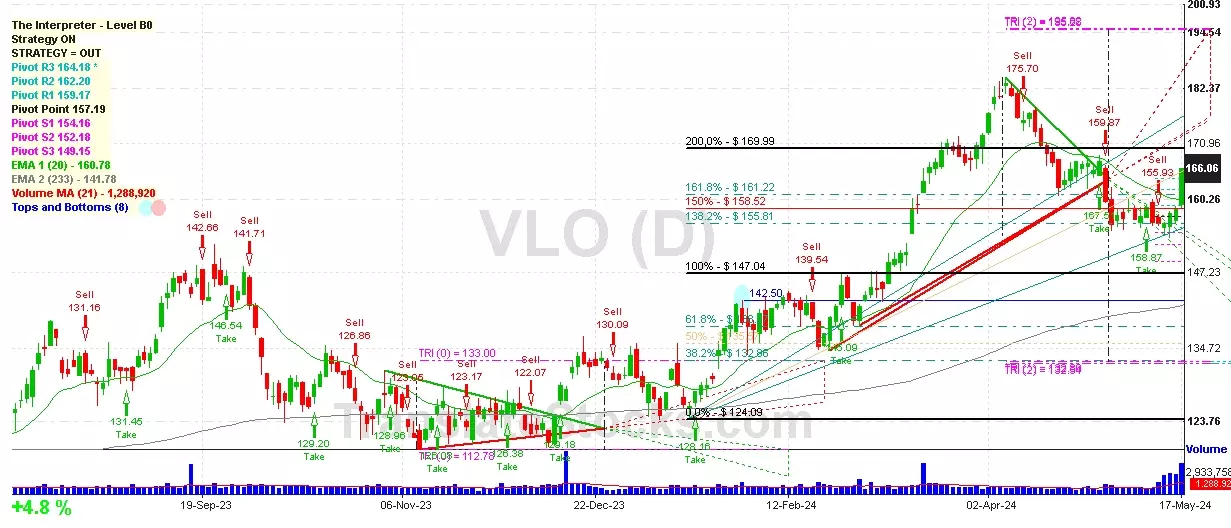