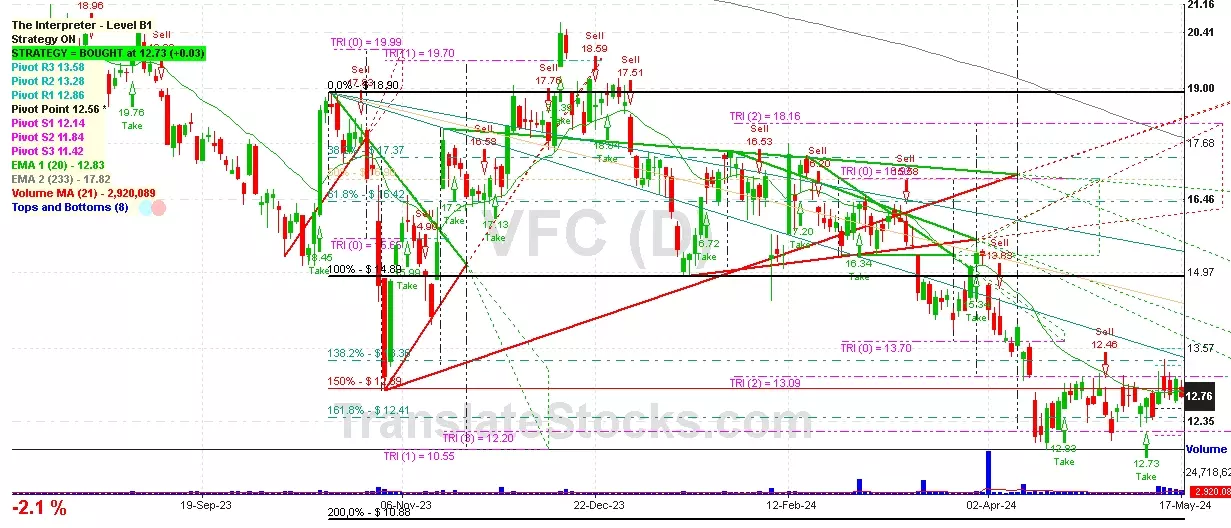
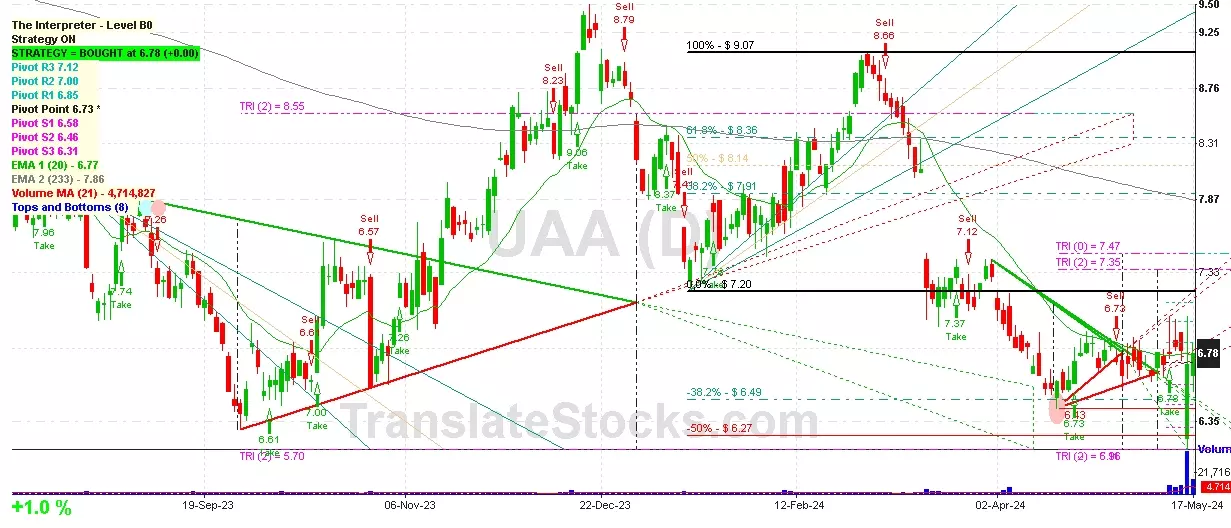
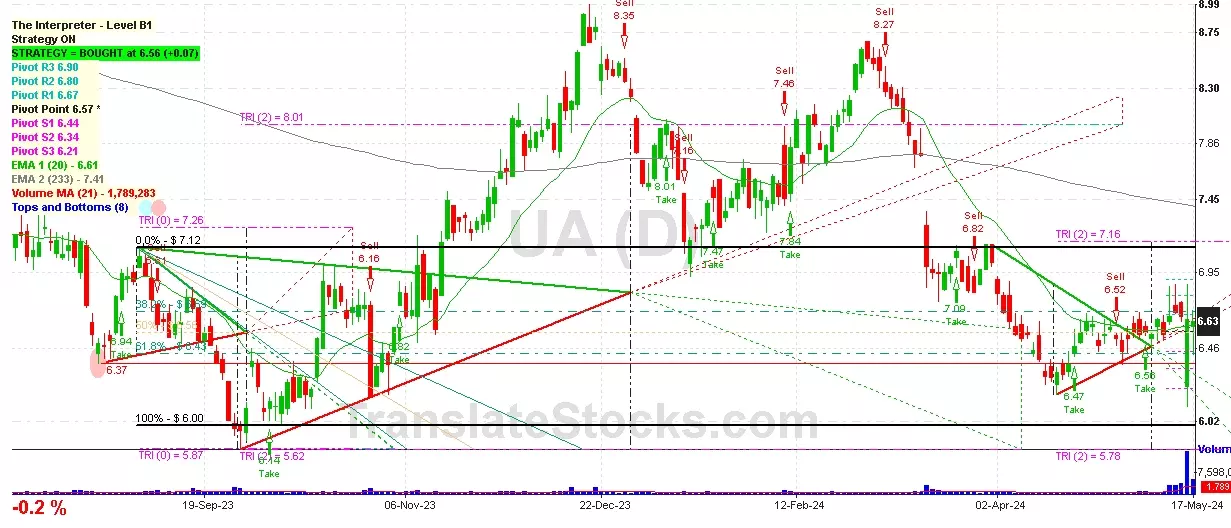
Hey Friend, I'm analysing UNDER ARMOUR INC CLASS C (UA), and it is between the Support of $ 6.57 (Pivot) and the Resistance of $ 6.67 (PivotR1). The stock is also approaching the line of PivotR1 at $ 6.67, and if it goes above this line it could reach the next Resistance of 38.2% of Fibonacci at $ 6.69.

| Date | Price $ | Result % | Candle Name | Side |
|---|---|---|---|---|
| 001 29 Feb 2024 | Sell Price: 8.54 | Profit: Close Day1 ($ 8.50) | Dark Cloud Cover | Sell |
| 002 20 Feb 2024 | Buy Price: 7.85 | Profit: Close Day1 ($ 8.00) | Piercing Line | Buy |
| 003 20 Oct 2023 | Sell Price: 6.76 | Profit: Open Day1 ($ 6.70) | Engulfing | Sell |
| 004 28 Sep 2023 | Buy Price: 6.10 | Profit: Open Day1 ($ 6.27) | Engulfing | Buy |
| 005 17 Aug 2023 | Sell Price: 7.05 | Profit: Open Day1 ($ 6.95) | Engulfing | Sell |
| 006 17 Aug 2023 | Sell Price: 7.07 | Profit: Open Day1 ($ 6.95) | Dark Cloud Cover | Sell |
| 007 16 Aug 2023 | Buy Price: 7.13 | Profit: Open Day1 ($ 7.17) | Abandoned Baby | Buy |
| 008 14 Aug 2023 | Buy Price: 7.17 | Loss: Close Day2 ($ 7.13) | Engulfing | Buy |
| 009 14 Aug 2023 | Buy Price: 7.18 | Loss: Close Day2 ($ 7.13) | Piercing Line | Buy |
| 010 20 Jun 2023 | Sell Price: 6.92 | Profit: Open Day1 ($ 6.89) | Abandoned Baby | Sell |
| 011One Year Average | Both Sides Result for 10 Signals |
Profit: $ 0.62 ($ 0.06 / Signal) |
All of Them | Buy + Sell |
| Simple Moving Averages (SMA) Period | Value $ | Signal | Exponential Moving Averages (EMA) Period | Value $ | Signal | |
|---|---|---|---|---|---|---|
| 2 | 6.64 | SELL | 2 | 6.64 | SELL | |
| 3 | 6.64 | SELL | 3 | 6.64 | SELL | |
| 5 | 6.66 | SELL | 5 | 6.64 | SELL | |
| 8 | 6.63 | BUY | 8 | 6.62 | BUY | |
| 13 | 6.59 | BUY | 13 | 6.61 | BUY | |
| 21 | 6.57 | BUY | 21 | 6.61 | BUY | |
| 34 | 6.53 | BUY | 34 | 6.68 | SELL | |
| 55 | 6.86 | SELL | 55 | 6.84 | SELL | |
| 90 | 7.20 | SELL | 90 | 7.01 | SELL | |
| 200 | 7.14 | SELL | 200 | 7.27 | SELL |
Under Armour Inc-class C
IPO: 2005-11-18
Ticker: UAIndices: S&P 500,
Exchange: New York Stock Exchange, Inc. (US - USD)
Website: https://www.underarmour.com/
Phone:
Common Stock
Manufacturing (
Apparel & Other Finishd Prods Of Fabrics & Similar Matl
Year | 2020 | 2019 | 2018 | 2017 | 2016 | 2015 | 2014 | 2013 | 2012 | 2011 | 2010 | 2009 | 2008 | 2007 | |
|---|---|---|---|---|---|---|---|---|---|---|---|---|---|---|---|
| 1 | Assets + | 5,031 | 4,844 | 4,245 | 4,006 | 3,644 | 2,869 | 2,095 | 1,578 | 1,157 | 919 | 675 | 546 | 102 | 41 |
| 2 | Cash and Cash Equivalents + | 1,517 | 788 | 557 | 312 | 250 | 130 | 593 | 347 | 342 | 175 | 204 | 187 | 102 | 41 |
| 3 | Property + | 659 | 792 | 827 | 886 | 804 | 539 | 306 | 224 | 181 | 159 | 76 | 73 | 0 | 0 |
| 4 | Property + | 1,542 | 1,602 | 1,482 | 1,413 | 1,201 | 832 | 522 | 396 | 326 | 274 | 163 | 0 | 0 | 0 |
| 5 | Intangible Assets + | 13 | 36 | 42 | 47 | 64 | 76 | 26 | 24 | 4 | 6 | 4 | 6 | 0 | 0 |
| 6 | Finite-Lived Intangible Assets + | 11 | 32 | 38 | 39 | 58 | 72 | 23 | 22 | 3 | 5 | 4 | 0 | 0 | 0 |
| 7 | Liabilities and Equity + | 5,031 | 4,844 | 4,245 | 4,006 | 3,644 | 2,869 | 2,095 | 1,578 | 1,157 | 919 | 675 | 546 | 331 | 280 |
| 8 | Liabilities + | 3,355 | 2,693 | 2,228 | 1,988 | 1,613 | 1,201 | 745 | 524 | 340 | 283 | 178 | 146 | 0 | 0 |
| 9 | Stockholders' Equity + | 1,676 | 2,150 | 2,017 | 2,019 | 2,031 | 1,668 | 1,350 | 1,053 | 817 | 636 | 497 | 400 | 331 | 280 |
| 10 | Stockholders' Equity Attributable to Parent + | 1,676 | 2,150 | 2,017 | 2,019 | 2,031 | 1,668 | 1,350 | 1,053 | 817 | 636 | 497 | 400 | 331 | 280 |
| 11 | Partners' Capital + | 674 | 1,227 | 1,139 | 1,184 | 1,259 | 1,077 | 857 | 654 | 493 | 366 | 270 | 202 | 0 | 0 |
| 12 | Partners' Capital + | 674 | 1,227 | 1,139 | 1,184 | 1,259 | 1,077 | 857 | 654 | 493 | 366 | 270 | 202 | 0 | 0 |
| 13 | Limited Liability Company (LLC) Members' Equity + | 615 | 1,176 | 1,100 | 1,146 | 1,259 | 1,077 | 857 | 654 | 493 | 366 | 270 | 202 | 0 | 0 |
| 14 | Limited Liability Company (LLC) Members' Equity + | 615 | 1,176 | 1,100 | 1,146 | 1,259 | 1,077 | 857 | 654 | 493 | 366 | 270 | 202 | 0 | 0 |
| 15 | Current Assets + | 3,223 | 2,702 | 2,594 | 2,338 | 1,965 | 1,499 | 1,549 | 1,129 | 904 | 690 | 556 | 448 | 0 | 0 |
| 16 | Current Other Undisclosed Receivables | 0 | 0 | 0 | 0 | 0 | 0 | 0 | 0 | 0 | 0 | 0 | 221 | 0 | 0 |
| 17 | Current Receivables + | 527 | 709 | 653 | 610 | 623 | 434 | 280 | 210 | 176 | 134 | 102 | 300 | 0 | 0 |
| 18 | Inventory + | 896 | 892 | 1,019 | 1,159 | 917 | 783 | 537 | 469 | 319 | 324 | 215 | 148 | 0 | 0 |
| 19 | Current Prepaid Expense + | 15 | 27 | 21 | 41 | 32 | 38 | 31 | 22 | 18 | 10 | 3 | 0 | 0 | 0 |
| 20 | Long-Term Assets + | 1,136 | 1,312 | 1,651 | 653 | 674 | 664 | 180 | 170 | 46 | 49 | 18 | 5 | 0 | 0 |
| 21 | Current Liabilities + | 1,413 | 1,422 | 1,316 | 1,060 | 686 | 479 | 422 | 427 | 252 | 184 | 149 | 120 | 0 | 0 |
| 22 | Long-Term Other Undisclosed Liabilities | 1 | -1 | 0 | 1 | 0 | 270 | -4 | -4 | -3 | -4 | -4 | 1 | 0 | 0 |
| 23 | Long-Term Liabilities + | 1,942 | 1,271 | 912 | 928 | 927 | 722 | 323 | 97 | 88 | 99 | 29 | 26 | 0 | 0 |
| 24 | Total Current Assets + | 3,223 | 2,702 | 2,594 | 2,338 | 1,965 | 1,499 | 1,549 | 1,129 | 904 | 690 | 556 | 448 | 0 | 0 |
| 25 | Operating Lease + | 537 | 592 | 0 | 0 | 0 | 0 | 0 | 0 | 0 | 0 | 0 | 0 | 0 | 0 |
| 26 | Goodwill + | 502 | 550 | 546 | 556 | 564 | 585 | 123 | 122 | 0 | 0 | 0 | 0 | 0 | 0 |
| 27 | Long-Term Other Assets + | 73 | 88 | 124 | 97 | 110 | 79 | 57 | 48 | 46 | 49 | 18 | 5 | 0 | 0 |
| 28 | Deferred Income Tax Assets + | 97 | 170 | 236 | 0 | 0 | 0 | 0 | 0 | 0 | 0 | 0 | 0 | 0 | 0 |
| 29 | Total Long-Term Assets + | 0 | 0 | 1,651 | 0 | 0 | 0 | 0 | 0 | 0 | 0 | 0 | 0 | 0 | 0 |
| 30 | Total Assets + | 5,031 | 4,844 | 4,245 | 4,006 | 3,644 | 2,869 | 2,095 | 1,578 | 1,157 | 919 | 675 | 546 | 0 | 0 |
| 31 | Total Liabilities + | 3,355 | 2,693 | 2,228 | 1,988 | 1,613 | 1,201 | 745 | 524 | 340 | 283 | 178 | 146 | 0 | 0 |
| 32 | Total Liabilities and Equity + | 5,031 | 4,844 | 4,245 | 4,006 | 3,644 | 2,869 | 2,095 | 1,578 | 1,157 | 919 | 675 | 546 | 0 | 0 |
Year | 2020 | 2019 | 2018 | 2017 | 2016 | 2015 | 2014 | 2013 | 2012 | 2011 | 2010 | 2009 | 2008 | |
|---|---|---|---|---|---|---|---|---|---|---|---|---|---|---|
| 1 | 4,475 | 5,267 | 5,193 | 4,989 | 4,833 | 0 | 0 | 2,082 | 1,650 | 1,326 | 0 | 0 | 0 | |
| 2 | -2,315 | -2,797 | -2,853 | -2,738 | -2,585 | 0 | 0 | 0 | 0 | 0 | 0 | 0 | 0 | |
| 3 | 2,160 | 2,471 | 2,340 | 2,239 | 2,241 | 1,906 | 1,512 | 1,137 | 879 | 713 | 531 | 410 | 353 | |
| 4 | 165 | 186 | 182 | 174 | 145 | 101 | 72 | 51 | 43 | 36 | 31 | 28 | 21 | |
| 5 | 0 | 0 | 0 | 0 | 0 | 0 | 0 | 0 | 0 | 2 | 0 | 0 | 0 | |
| 6 | 2,172 | 2,234 | 2,182 | 2,087 | 1,823 | 1,497 | 1,158 | 872 | 671 | 550 | 418 | 325 | 276 | |
| 7 | 10 | 0 | 0 | 0 | 0 | 0 | 0 | 0 | 0 | 0 | 0 | 0 | 0 | |
| 8 | -4 | -5 | -4 | -2 | -2 | -1 | 0 | 0 | -1 | 0 | 0 | 0 | 0 | |
| 9 | -613 | 237 | -25 | 28 | 417 | 409 | 354 | 265 | 209 | 163 | 112 | 85 | 77 | |
| 10 | 179 | 0 | 0 | 0 | 0 | 0 | 0 | 0 | 0 | 0 | 0 | 0 | 0 | |
| 11 | 168 | -6 | -9 | -4 | -3 | -7 | -6 | -1 | 0 | -2 | -1 | -1 | -6 | |
| 12 | 0 | 0 | 0 | 0 | 0 | 15 | 5 | 3 | 5 | 4 | 2 | 2 | 0 | |
| 13 | -493 | 210 | -68 | -10 | 388 | 387 | 342 | 261 | 203 | 157 | 109 | 82 | 70 | |
| 14 | -7 | -48 | 1 | 0 | 0 | 0 | 0 | 0 | 0 | 0 | 0 | 0 | 0 | |
| 15 | -49 | -70 | 21 | -38 | -131 | -154 | -134 | -99 | -75 | -60 | -40 | -36 | -32 | |
| 16 | Total Net Income (Loss) Attributable to Parent + | -549 | 92 | -46 | -48 | 257 | 233 | 208 | 162 | 129 | 97 | 68 | 47 | 38 |
| 17 | Total Earnings Per Share + | -1.21 | 0.20 | -0.10 | -0.11 | 0 | 1.08 | 0.98 | 1.54 | 1.23 | 1.88 | 1.35 | 0.94 | 0.78 |
| 18 | Total Earnings Per Share + | -1.21 | 0.20 | -0.10 | -0.11 | 0 | 1.05 | 0.95 | 1.50 | 1.21 | 1.85 | 1.34 | 0.92 | 0.76 |
 Click to Enlarge